Free Access
Fig. 2.
Download original image
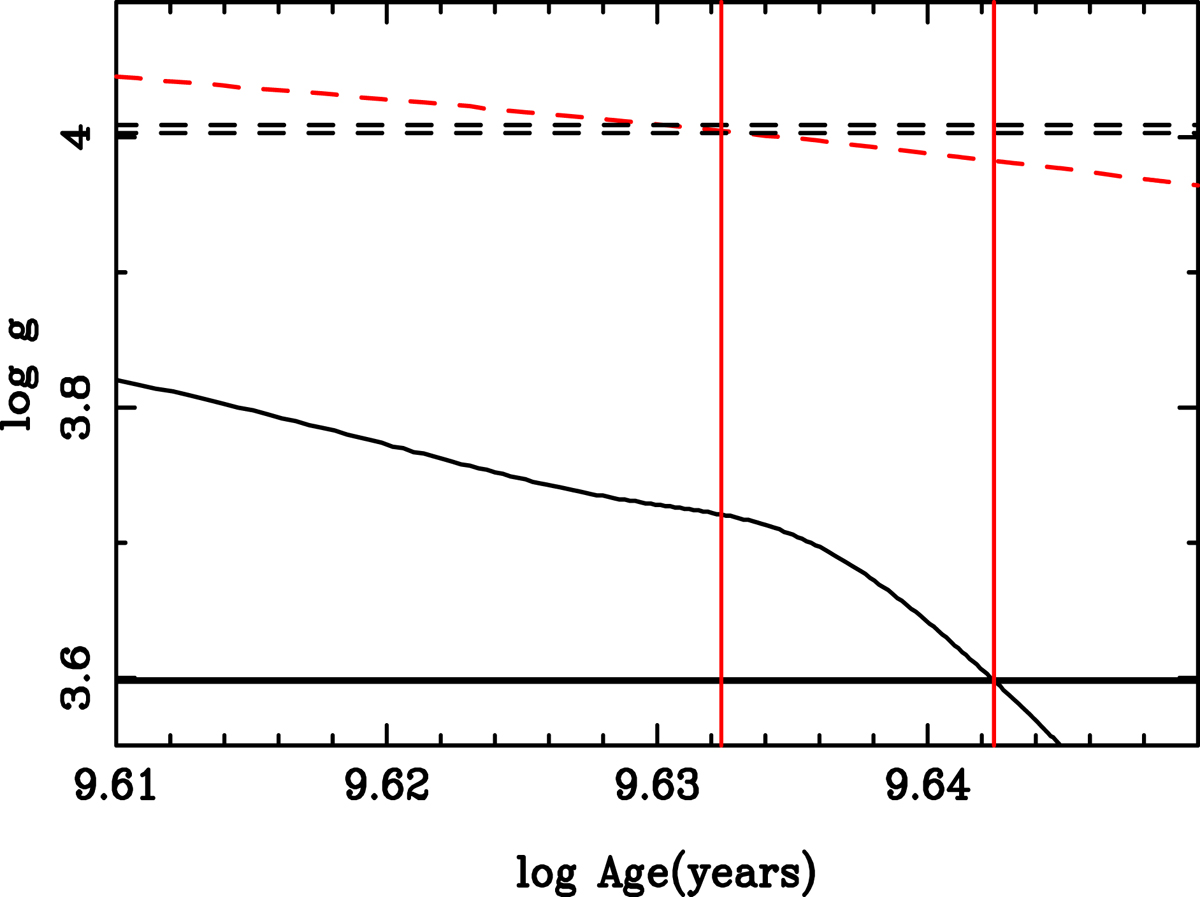
log g and respective error bars as a function of time for AI Phe. The two vertical lines indicate the time interval corresponding to the individual ages for each component. The horizontal lines represent the error bars in log g. Line coding as in Fig. 1.
Current usage metrics show cumulative count of Article Views (full-text article views including HTML views, PDF and ePub downloads, according to the available data) and Abstracts Views on Vision4Press platform.
Data correspond to usage on the plateform after 2015. The current usage metrics is available 48-96 hours after online publication and is updated daily on week days.
Initial download of the metrics may take a while.