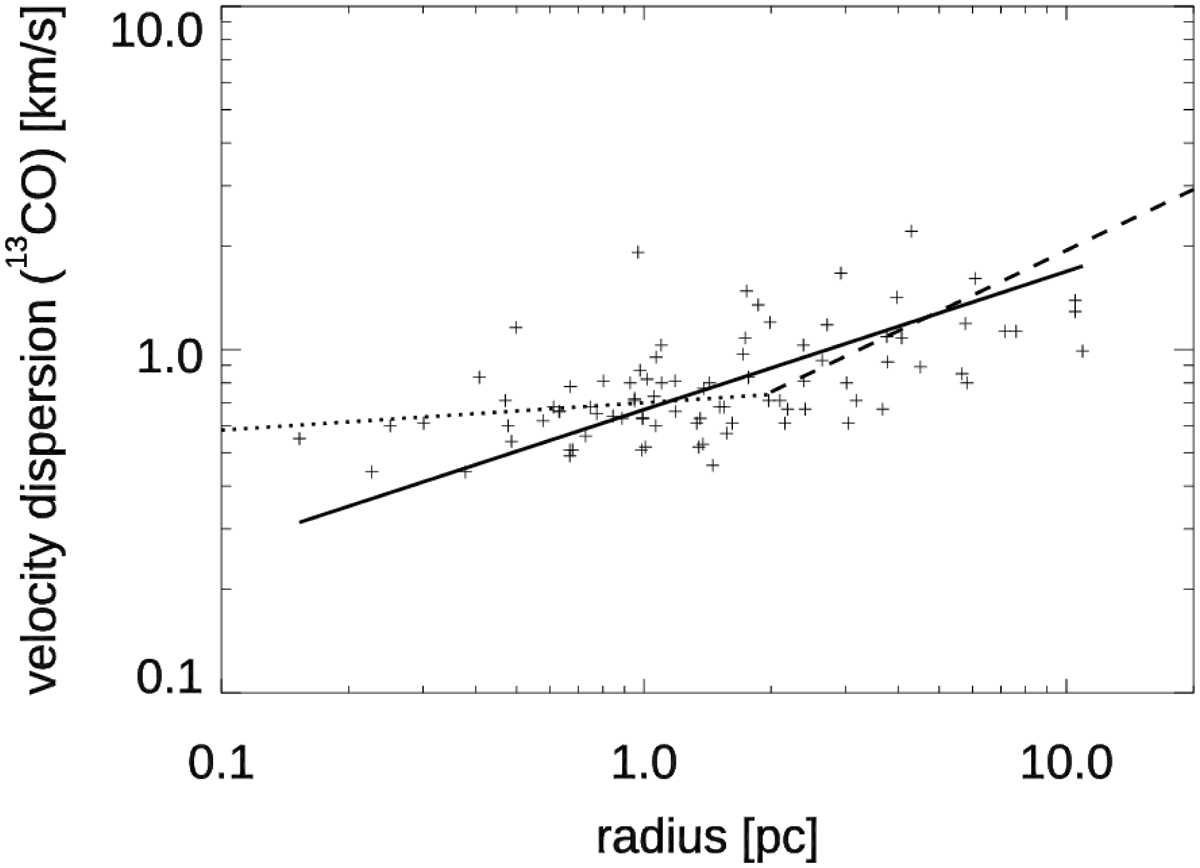
Fig. 8.
Download original image
Radius vs. velocity dispersion plot of MCs of the 13CO catalogue. The solid line represents the best fit for the relation σv = aRβ in the full radius range. The best-fit coefficients are a = 0.67 and β = 0.4. The dotted and dashed lines correspond to the relations derived in Paper I for the 12CO catalogue rescaled to this set of data: a = 0.7 and β = 0.08 for R < 2 (dotted line), and a = 0.5 and β = 0.59 for R > 2 (dashed line).
Current usage metrics show cumulative count of Article Views (full-text article views including HTML views, PDF and ePub downloads, according to the available data) and Abstracts Views on Vision4Press platform.
Data correspond to usage on the plateform after 2015. The current usage metrics is available 48-96 hours after online publication and is updated daily on week days.
Initial download of the metrics may take a while.