Fig. 7.
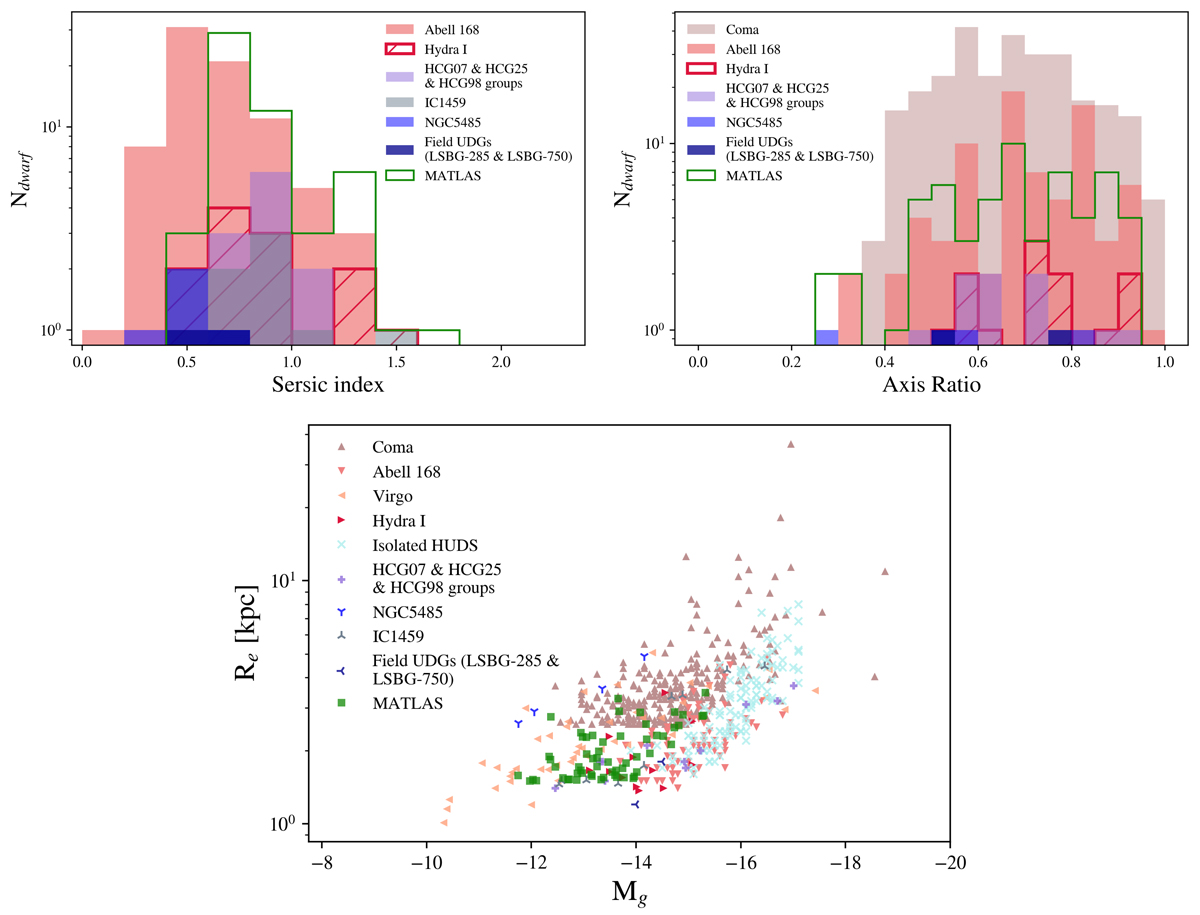
Download original image
Structural properties of the MATLAS UDGs as compared to the ones of UDGs from the Coma, Abell 168, Virgo and Hydra I clusters (Zaritsky et al. 2019; Román & Trujillo 2017a; Lim et al. 2020; Iodice et al. 2020), from the HCG 07, HCG 25, HCG 98, IC 1459 and NGC 5485 groups (Román & Trujillo 2017b; Forbes et al. 2020; Merritt et al. 2016) as well as of isolated UDGs (HI-bearing UDGs sample, LSBG-285 and LSBG-750, Leisman et al. 2017; Greco et al. 2018). We display the UDGs from high density (cluster) environments with shades of red and triangular markers, the UDGs from moderate (group) to low (field) density environments with shades of blue and cross-like markers and the MATLAS UDGs with a green color and squares. Top: distributions of Sérsic index (left) and axis-ratio (right). Bottom: scaling relation Mg vs. Re. We note that a different cut in size and surface brightness was applied to select the UDG samples in Greco et al. (2018), Lim et al. (2020), Zaritsky et al. (2019), Román & Trujillo (2017b), Leisman et al. (2017).
Current usage metrics show cumulative count of Article Views (full-text article views including HTML views, PDF and ePub downloads, according to the available data) and Abstracts Views on Vision4Press platform.
Data correspond to usage on the plateform after 2015. The current usage metrics is available 48-96 hours after online publication and is updated daily on week days.
Initial download of the metrics may take a while.