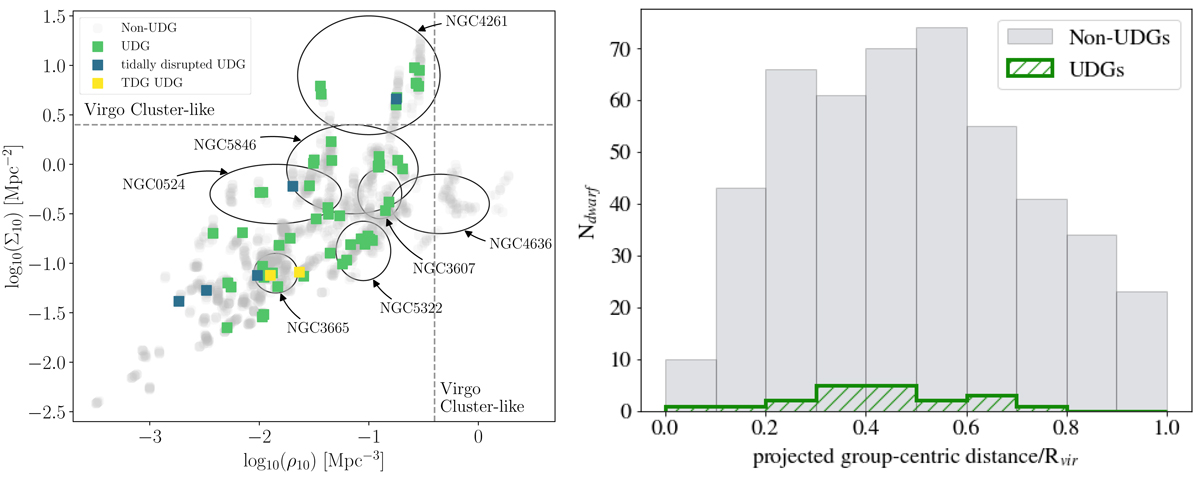
Fig. 3.
Download original image
Left: estimates of the local volume density (ρ10) versus the local surface density (Σ10) for the MATLAS traditional dwarf (non-UDG) galaxies (gray circles) and UDGs (green squares). The tidally disrupted UDGs and TDG UDGs discussed in Sect. 7 are marked in turquoise and yellow, respectively. The density estimates were calculated based on the tenth-nearest neighbor, using only the massive galaxies from the ATLAS3D parent sample. Cappellari et al. (2011b) noted that nearly all galaxies in the Virgo cluster have log10ρ10 > −0.4 and log10Σ10 > 0.4; these boundaries are marked with dashed lines. The open ovals indicate where the dwarfs in select groups fall in the plot. Right: radial distribution of traditional dwarf (non-UDG) galaxies (filled gray) and UDGs (hashed green) in the group environments defined in Table 1. The projected group-centric distances have been normalized such that Rvir = 1. A KS test returns a p-value of 0.35, thus we cannot reject the null-hypothesis that the two samples originate from the same parent sample.
Current usage metrics show cumulative count of Article Views (full-text article views including HTML views, PDF and ePub downloads, according to the available data) and Abstracts Views on Vision4Press platform.
Data correspond to usage on the plateform after 2015. The current usage metrics is available 48-96 hours after online publication and is updated daily on week days.
Initial download of the metrics may take a while.