Fig. 9.
Download original image
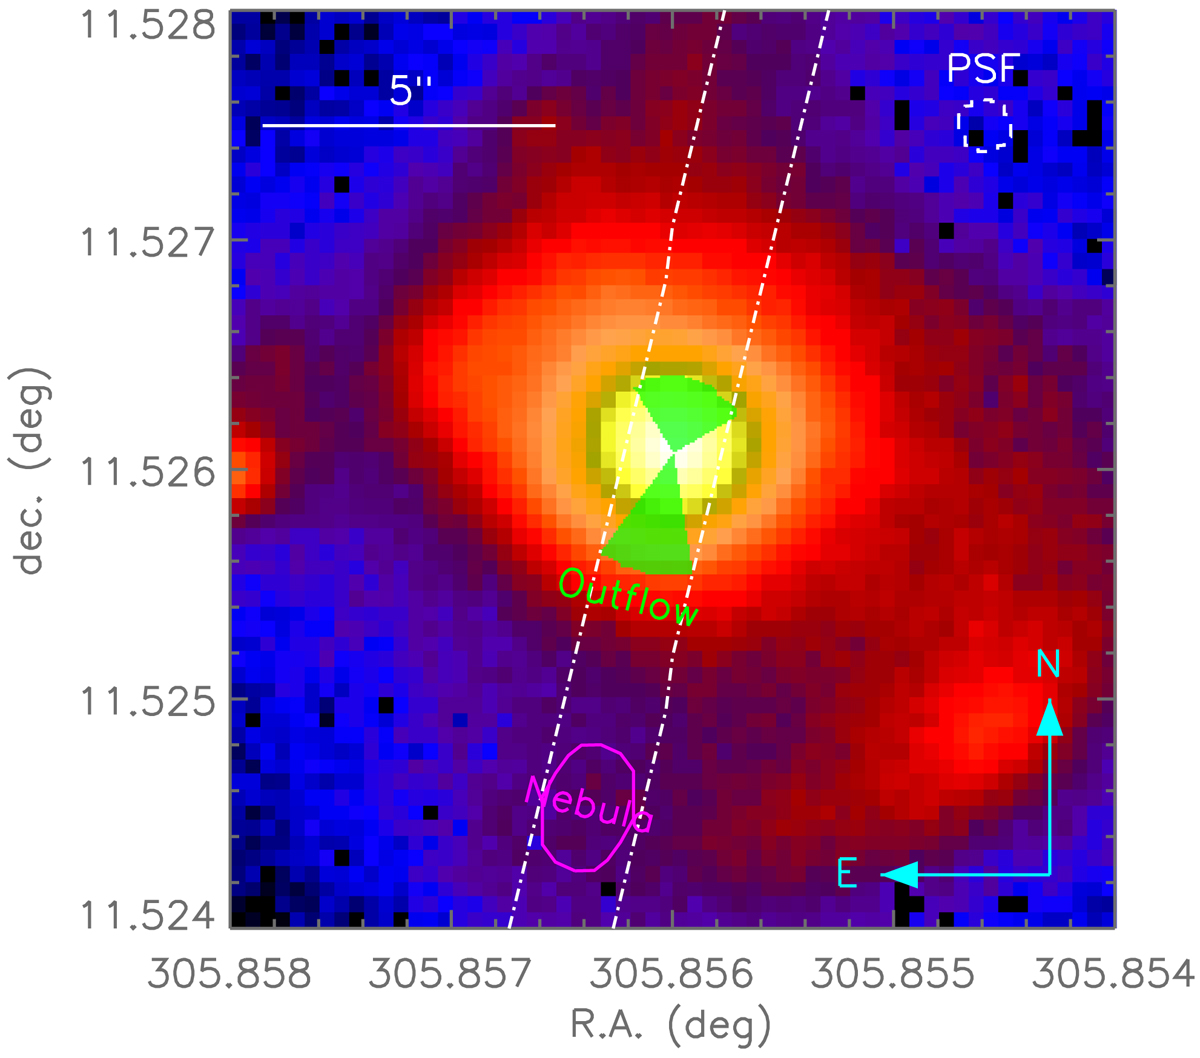
Schematic representation of the emitting components observed in the spectrum of I20210S: the high-velocity outflow (green shaded area) – assumed biconical for simplicity, since only one slit position is available and the PSF size prevents us from resolving the morphology of such a small structure – and the South Nebula (magenta solid ellipse), plotted on top of the PS1 grizy image of the galaxy. The slit position and orientation (white dot-dashed lines) are reported; in the upper left corner, the diameter of ![]() of the DOLoRes PSF (white dashed circle) is also indicated.
of the DOLoRes PSF (white dashed circle) is also indicated.
Current usage metrics show cumulative count of Article Views (full-text article views including HTML views, PDF and ePub downloads, according to the available data) and Abstracts Views on Vision4Press platform.
Data correspond to usage on the plateform after 2015. The current usage metrics is available 48-96 hours after online publication and is updated daily on week days.
Initial download of the metrics may take a while.