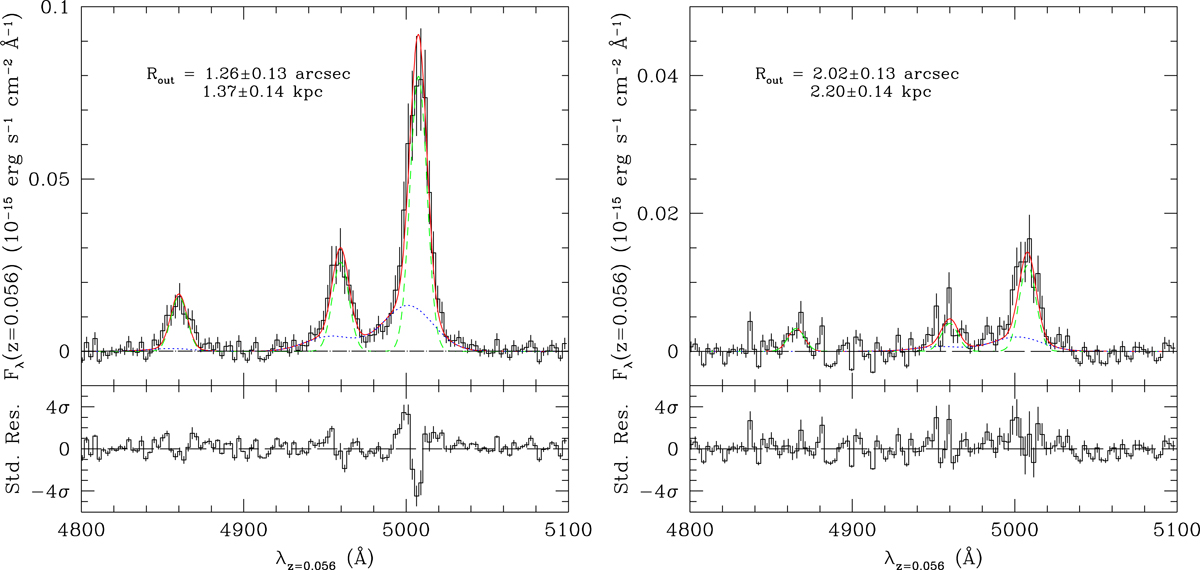
Fig. 8.
Download original image
Continuum-subtracted I20210S off-axis Hβ+[O III] spectra extracted at a 5 px offset in the northern direction (left panel) and at an 8 px offset in the southern direction (right panel). In each panel, the best-fit model is shown (red solid line) along with the profiles of the narrow (green short-dashed line) and broad components (blue dotted line), and the zero-flux level is indicated (black long-dashed line). The standardized residuals after the best-fit subtraction are also shown in separate windows below each spectral region. The fit to the Hβ emission is not accounted for the calculations of χ2 and pF, which are performed on the [O III] doublet only (see text), and is shown here for visual purposes only.
Current usage metrics show cumulative count of Article Views (full-text article views including HTML views, PDF and ePub downloads, according to the available data) and Abstracts Views on Vision4Press platform.
Data correspond to usage on the plateform after 2015. The current usage metrics is available 48-96 hours after online publication and is updated daily on week days.
Initial download of the metrics may take a while.