Fig. 7.
Download original image
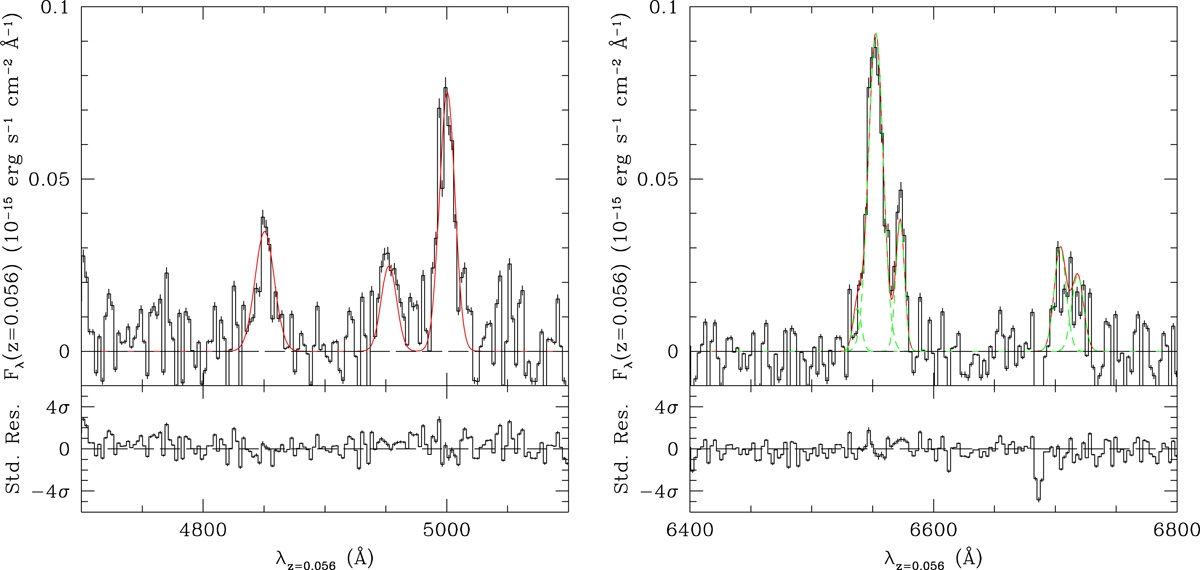
Best-fit profiles of the emission lines from the South Nebula in the rest frame. Left panel: the Hβ+[O III] spectral region. Right panel: the Hα+[N II] and [S II] spectral region. In both panels, the global emission profile (red solid line) is shown superimposed to the line spectrum (black histogram) along with the single components of the Hα+[N II] and [S II] blended profiles (green short-dashed lines), and the zero-flux level (black long-dashed line) is indicated. The standardized residuals after the best-fit subtraction are also shown in separate windows below each spectral region.
Current usage metrics show cumulative count of Article Views (full-text article views including HTML views, PDF and ePub downloads, according to the available data) and Abstracts Views on Vision4Press platform.
Data correspond to usage on the plateform after 2015. The current usage metrics is available 48-96 hours after online publication and is updated daily on week days.
Initial download of the metrics may take a while.