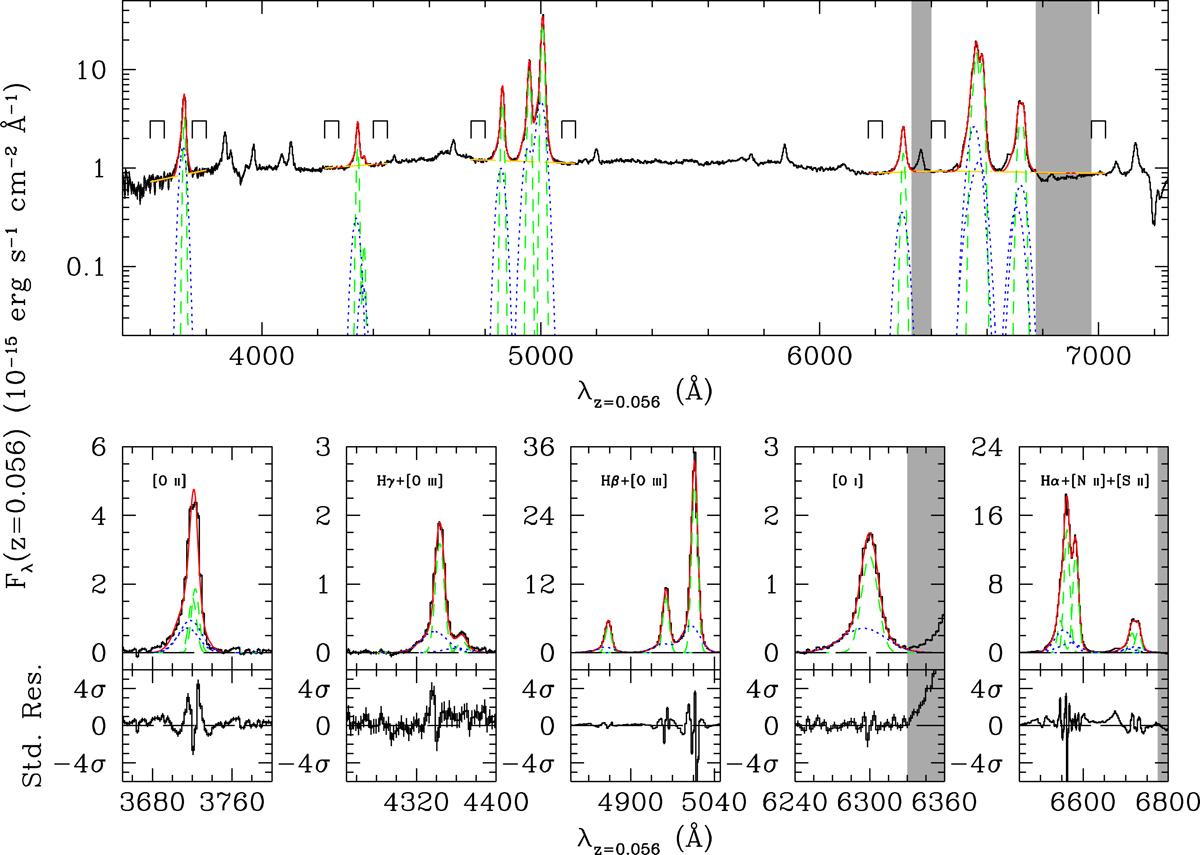
Fig. 6.
Download original image
Model of the rest-frame spectrum of I20210S. Upper panel: full I20210S spectrum (black solid line), along with the local power laws adopted for continuum subtraction (yellow dot-dashed lines), the best-fit reddened narrow (green short-dashed lines) and broad emission profiles (blue dotted lines), and the global spectral model (red solid line) shown superimposed to the data. The intervals used for the local continuum subtraction under the emission lines are marked, along with the masks applied to the [O I]+[Fe X] emission and to the telluric H2O absorption line (grey bands). Lower panel: zoom on the continuum-subtracted emission lines (black solid line), shown along with the global best fit (red solid line) and the best-fit narrow (green short-dashed lines) and broad components (blue dotted lines). The standardized residuals after the best-fit subtraction are also shown in separate windows below each spectral region. In all panels, the zero-level flux (black long-dashed line) is indicated; in the panel with [O I], the mask applied to the [O I]+[Fe X] emission line is shown superimposed to the data, as well as the one for the H2O telluric absorption in the panel with Hα+[N II] and [S II] (grey bands).
Current usage metrics show cumulative count of Article Views (full-text article views including HTML views, PDF and ePub downloads, according to the available data) and Abstracts Views on Vision4Press platform.
Data correspond to usage on the plateform after 2015. The current usage metrics is available 48-96 hours after online publication and is updated daily on week days.
Initial download of the metrics may take a while.