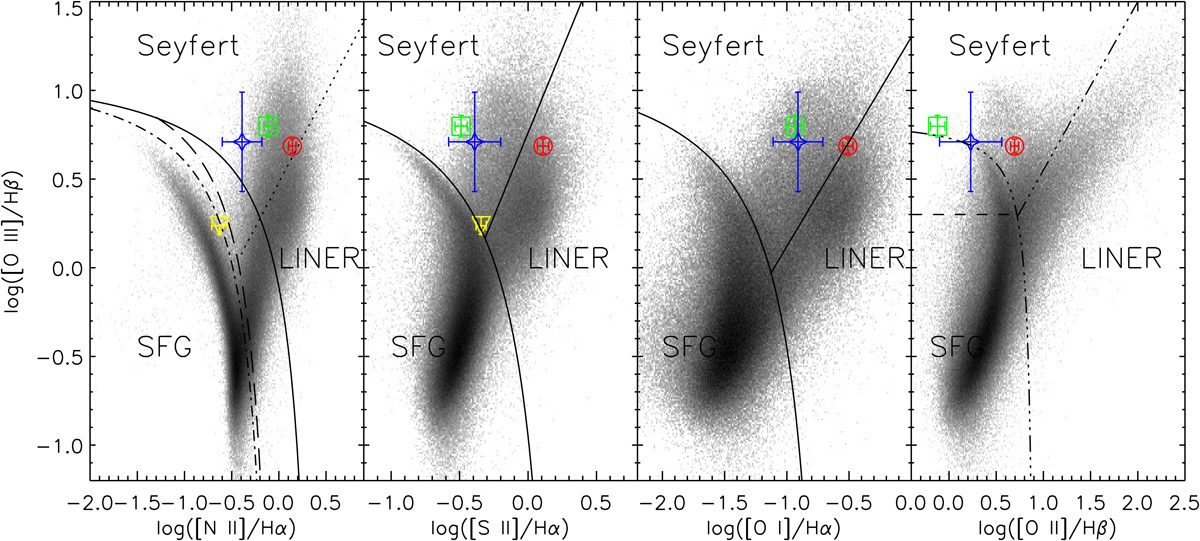
Fig. 5.
Download original image
BPT diagnostic diagrams showing the position of I20210N (red circle), I20210S (green square) and its outflow (blue star), and the South Nebula (yellow triangle), along with the relative uncertainties on top of the SDSS data from the OSSY database (Oh et al. 2015, grey dots). As a reference, in the first three panels, the extreme-starburst and Seyfert–LINER classification boundaries by Kewley et al. (2001, solid lines) are indicated, along with the pure star-formation boundary by Kauffmann et al. (2003, long-dashed line), the alternative Seyfert–LINER relation by Cid Fernandes et al. (2010, dotted line), and the redshift-dependent relation at z ∼ 0.13 by Kewley et al. (2013a, dot-dashed line) in the [O III]/Hβ-to-[N II]/Hα diagram. In the [O III]/Hβ-to-[O II]/Hβ diagram, the star-forming and Seyfert–LINER boundaries by Lamareille (2010, triple dot-dashed line) are indicated, along with the mixed-region boundary (short-dashed line).
Current usage metrics show cumulative count of Article Views (full-text article views including HTML views, PDF and ePub downloads, according to the available data) and Abstracts Views on Vision4Press platform.
Data correspond to usage on the plateform after 2015. The current usage metrics is available 48-96 hours after online publication and is updated daily on week days.
Initial download of the metrics may take a while.