Fig. 3.
Download original image
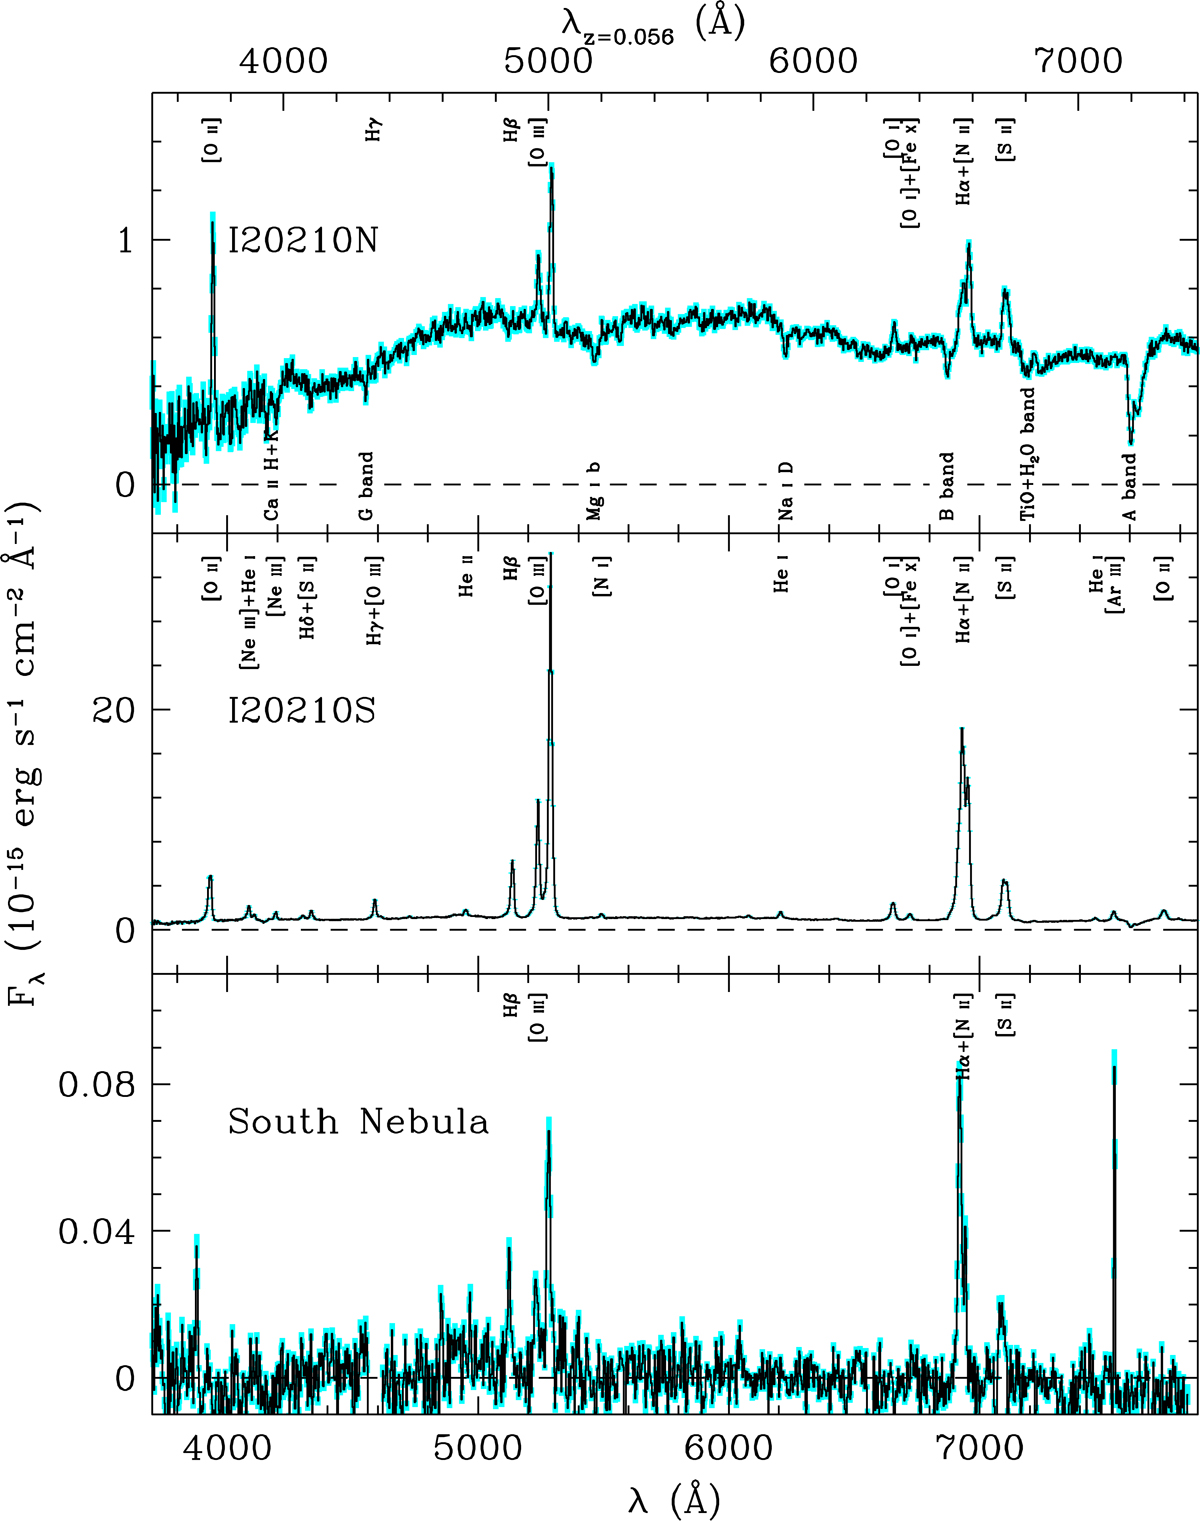
Optical spectra of the I20210 components. Top panel: I20210N. Middle panel: I20210S. Bottom panel: the spatially extended South Nebula. In all panels: (i) the detected signal is reported along with its rms uncertainty (cyan bands); (ii) the zero-flux level (dashed line) is indicated; and (iii) the positions of major emission (top) and absorption features (bottom) are labeled accordingly.
Current usage metrics show cumulative count of Article Views (full-text article views including HTML views, PDF and ePub downloads, according to the available data) and Abstracts Views on Vision4Press platform.
Data correspond to usage on the plateform after 2015. The current usage metrics is available 48-96 hours after online publication and is updated daily on week days.
Initial download of the metrics may take a while.