Fig. 2.
Download original image
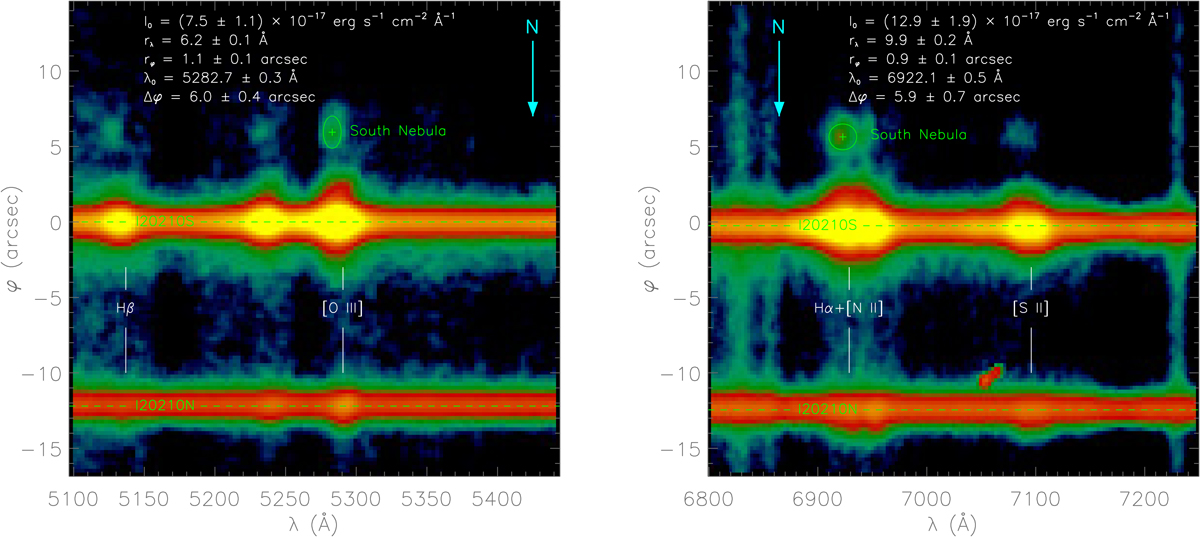
2D spectral sections of the I20210 system. Left panel: the Hβ and [O III] region. Right panel: Hα+[N II] and [S II] region. In both panels, the trace centers of the main components are identified for reference (green dashed lines). The elliptical fits to the [O III] and Hα+[N II] emissions from the South Nebula are reported (green ellipses) along with the respective best-fit parameters and statistical uncertainties. In the right panel, the vertical features are sky lines, whereas the extrusion close to the [S II] emission of I20210N is a cluster of saturated pixels that is excluded from the IRAF extraction of the 1D spectrum.
Current usage metrics show cumulative count of Article Views (full-text article views including HTML views, PDF and ePub downloads, according to the available data) and Abstracts Views on Vision4Press platform.
Data correspond to usage on the plateform after 2015. The current usage metrics is available 48-96 hours after online publication and is updated daily on week days.
Initial download of the metrics may take a while.