Fig. 1.
Download original image
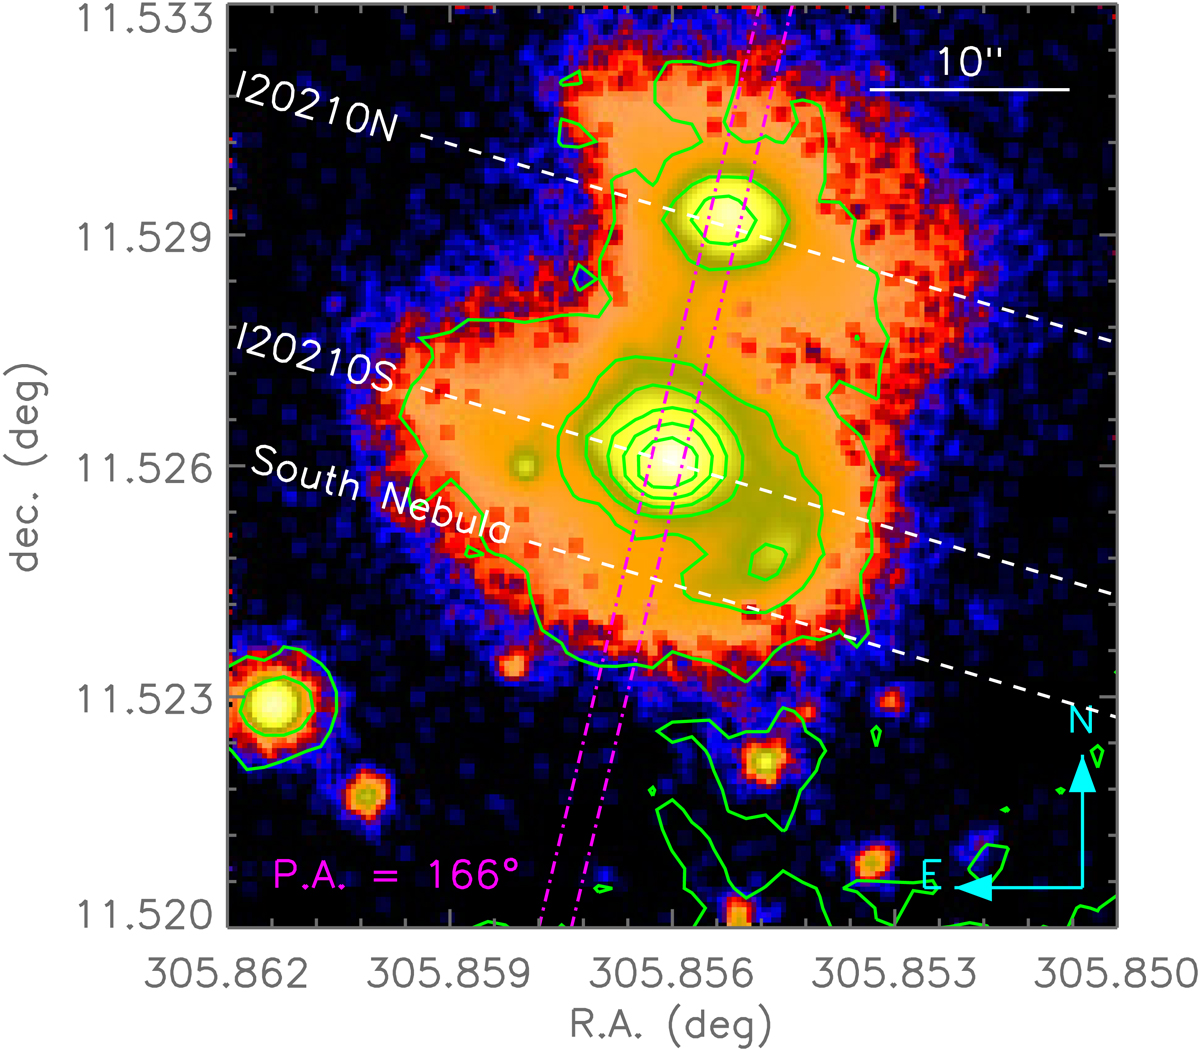
Image in false colors of the I20210 system, obtained by combining the grizy exposures of the Pan-STARRS1 survey (PS1; Chambers 2016) centered on the sky coordinates of I20210S (αJ2000 = 20 23 25.4, δJ2000 = +11 31 34.7). The isophotes of the XMM-Newton Optical Monitor (OM) UVW1 mosaic exposure (green solid lines) taken simultaneously to the X-ray data analyzed by Piconcelli et al. (2010) – along with some of the associated CCD count levels – are drawn onto the PS1 image to highlight weak features. The TNG slit direction and position (magenta dot-dashed lines) are also indicated along with the positions and directions of the trace centers (white dashed lines) identified to extract the 1D spectrum of each object.
Current usage metrics show cumulative count of Article Views (full-text article views including HTML views, PDF and ePub downloads, according to the available data) and Abstracts Views on Vision4Press platform.
Data correspond to usage on the plateform after 2015. The current usage metrics is available 48-96 hours after online publication and is updated daily on week days.
Initial download of the metrics may take a while.