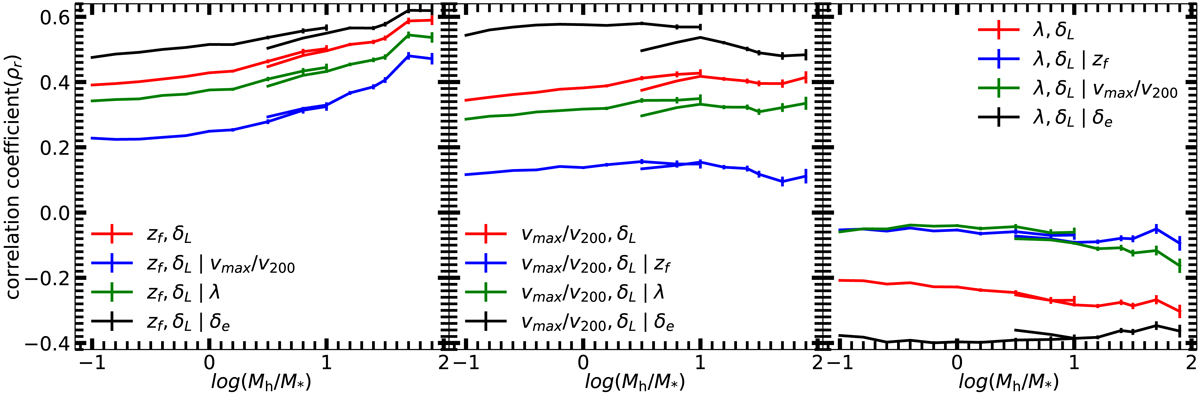
Fig. 8.
Download original image
Pearson coefficients for the (partial) correlations of δL with halo properties, zf (left panel), vmax/v200 (middle panel), and λ (right panel), as a function of halo mass. As indicated in each panel, the red lines show the results of the correlations between δL and halo properties, the blue and green lines show the results with another property controlled, and the black lines show the results with δe controlled. The error bar shows the standard deviation calculated from 200 bootstrap samples.
Current usage metrics show cumulative count of Article Views (full-text article views including HTML views, PDF and ePub downloads, according to the available data) and Abstracts Views on Vision4Press platform.
Data correspond to usage on the plateform after 2015. The current usage metrics is available 48-96 hours after online publication and is updated daily on week days.
Initial download of the metrics may take a while.