Fig. 1.
Download original image
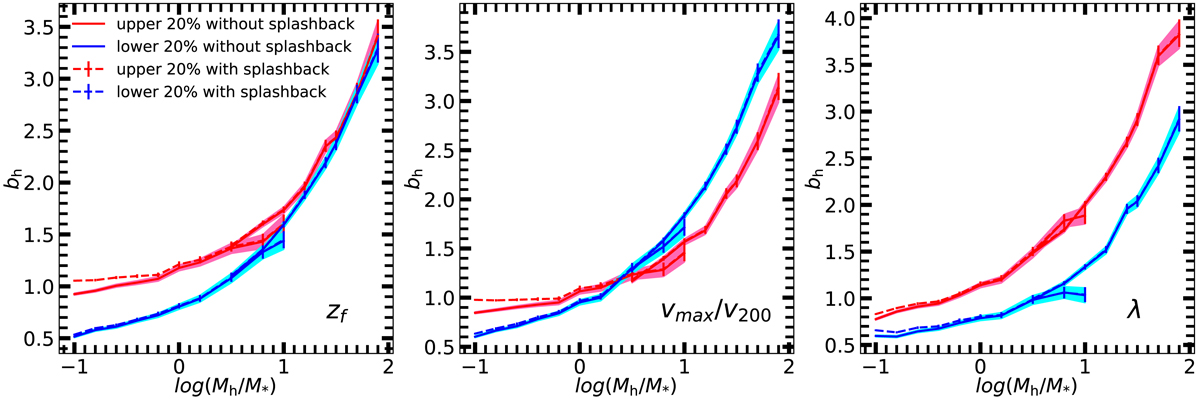
Halo bias factor as a function of halo mass and other halo properties. In each panel the red (blue) lines show the results for halos in the upper (lower) 20% tails of the distribution of the halo property indicated in the panel. The dashed line shows the result for all halos, while the solid line shows the result excluding splashback halos. Results are shown for ELUCID and S1k halos in the mass ranges of log(Mh/M*) < 1 and log(Mh/M*) > 0.5, respectively. Error bars are the standard deviation calculated using 1000 bootstrap samples.
Current usage metrics show cumulative count of Article Views (full-text article views including HTML views, PDF and ePub downloads, according to the available data) and Abstracts Views on Vision4Press platform.
Data correspond to usage on the plateform after 2015. The current usage metrics is available 48-96 hours after online publication and is updated daily on week days.
Initial download of the metrics may take a while.