Fig. 7.
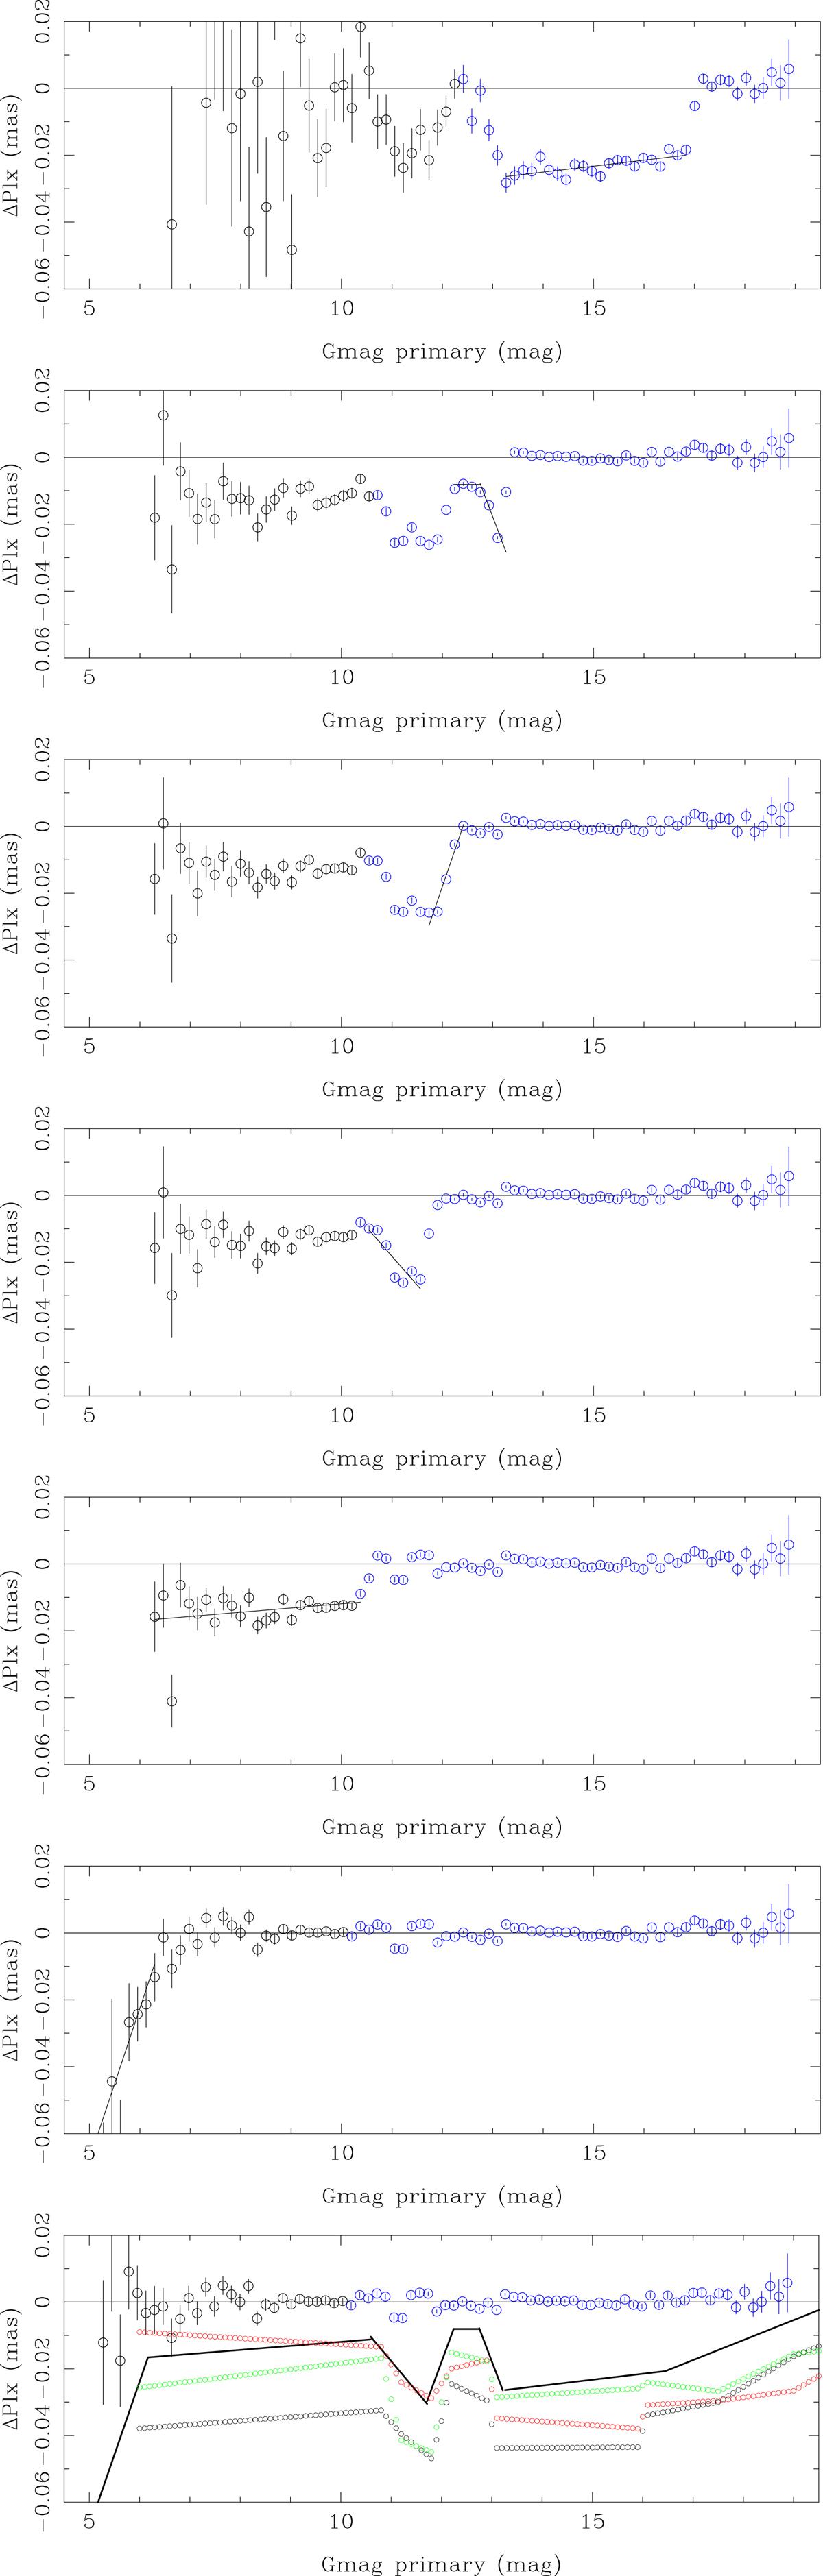
Download original image
As in Fig. 5 but with parallaxes corrected according to Eq. (7) in consecutive steps (see main text). The bottom panel shows the applied correction (Eq. (7)) as the black line. The small black, red, and green circles represent the L20 correction for β = 0, −60, and +60°. There is an offset as the L20 corrections are absolute, while the corrections applied to the WB sample are relative to the correction at G = 20 mag.
Current usage metrics show cumulative count of Article Views (full-text article views including HTML views, PDF and ePub downloads, according to the available data) and Abstracts Views on Vision4Press platform.
Data correspond to usage on the plateform after 2015. The current usage metrics is available 48-96 hours after online publication and is updated daily on week days.
Initial download of the metrics may take a while.