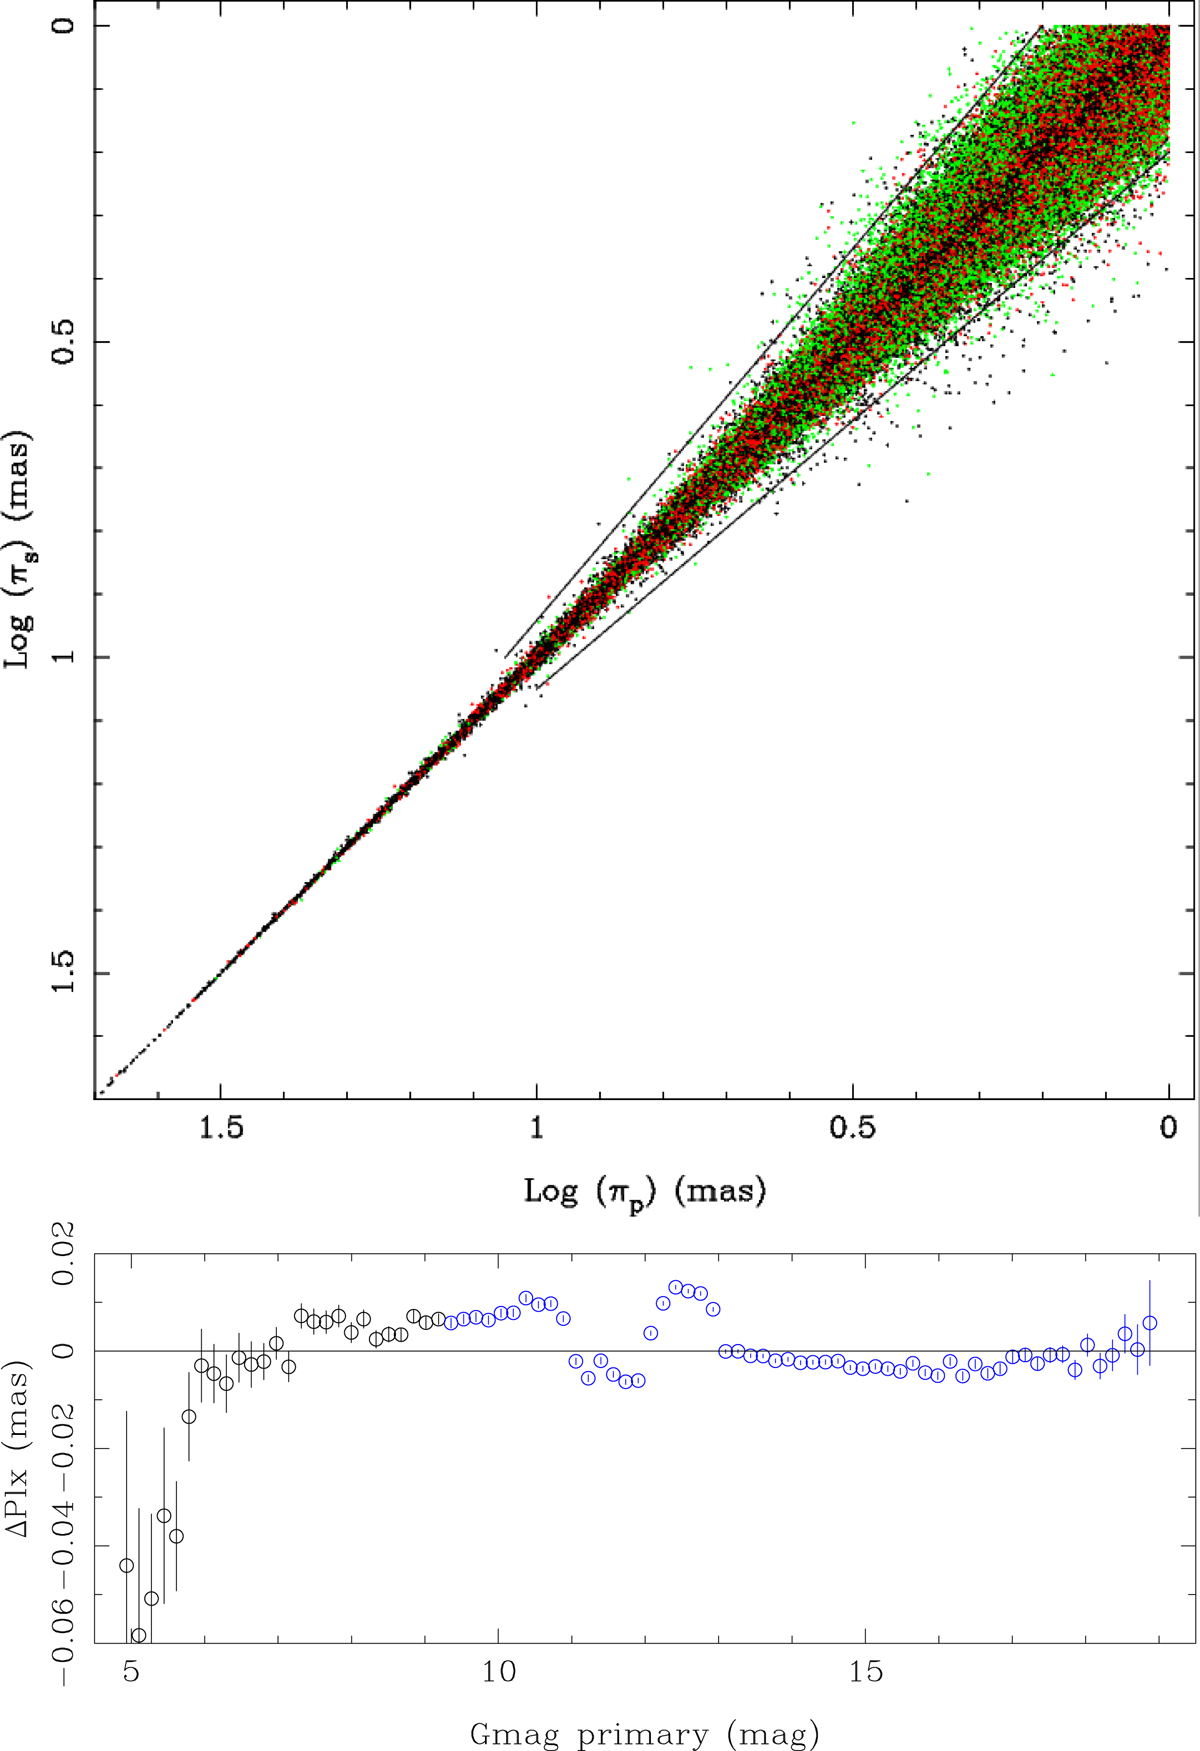
Fig. 6.
Download original image
As in Fig. 5 but for Gs restricted to < 19.0 mag. After eliminating about 700 extreme outliers (those outside the two plotted lines in the top panel), a sample of about 480 000 objects remain. The bottom panel shows the parallax difference between primary and secondary component for that sample as a function of Gp. We note the different range in the ordinate compared to Fig. 5.
Current usage metrics show cumulative count of Article Views (full-text article views including HTML views, PDF and ePub downloads, according to the available data) and Abstracts Views on Vision4Press platform.
Data correspond to usage on the plateform after 2015. The current usage metrics is available 48-96 hours after online publication and is updated daily on week days.
Initial download of the metrics may take a while.