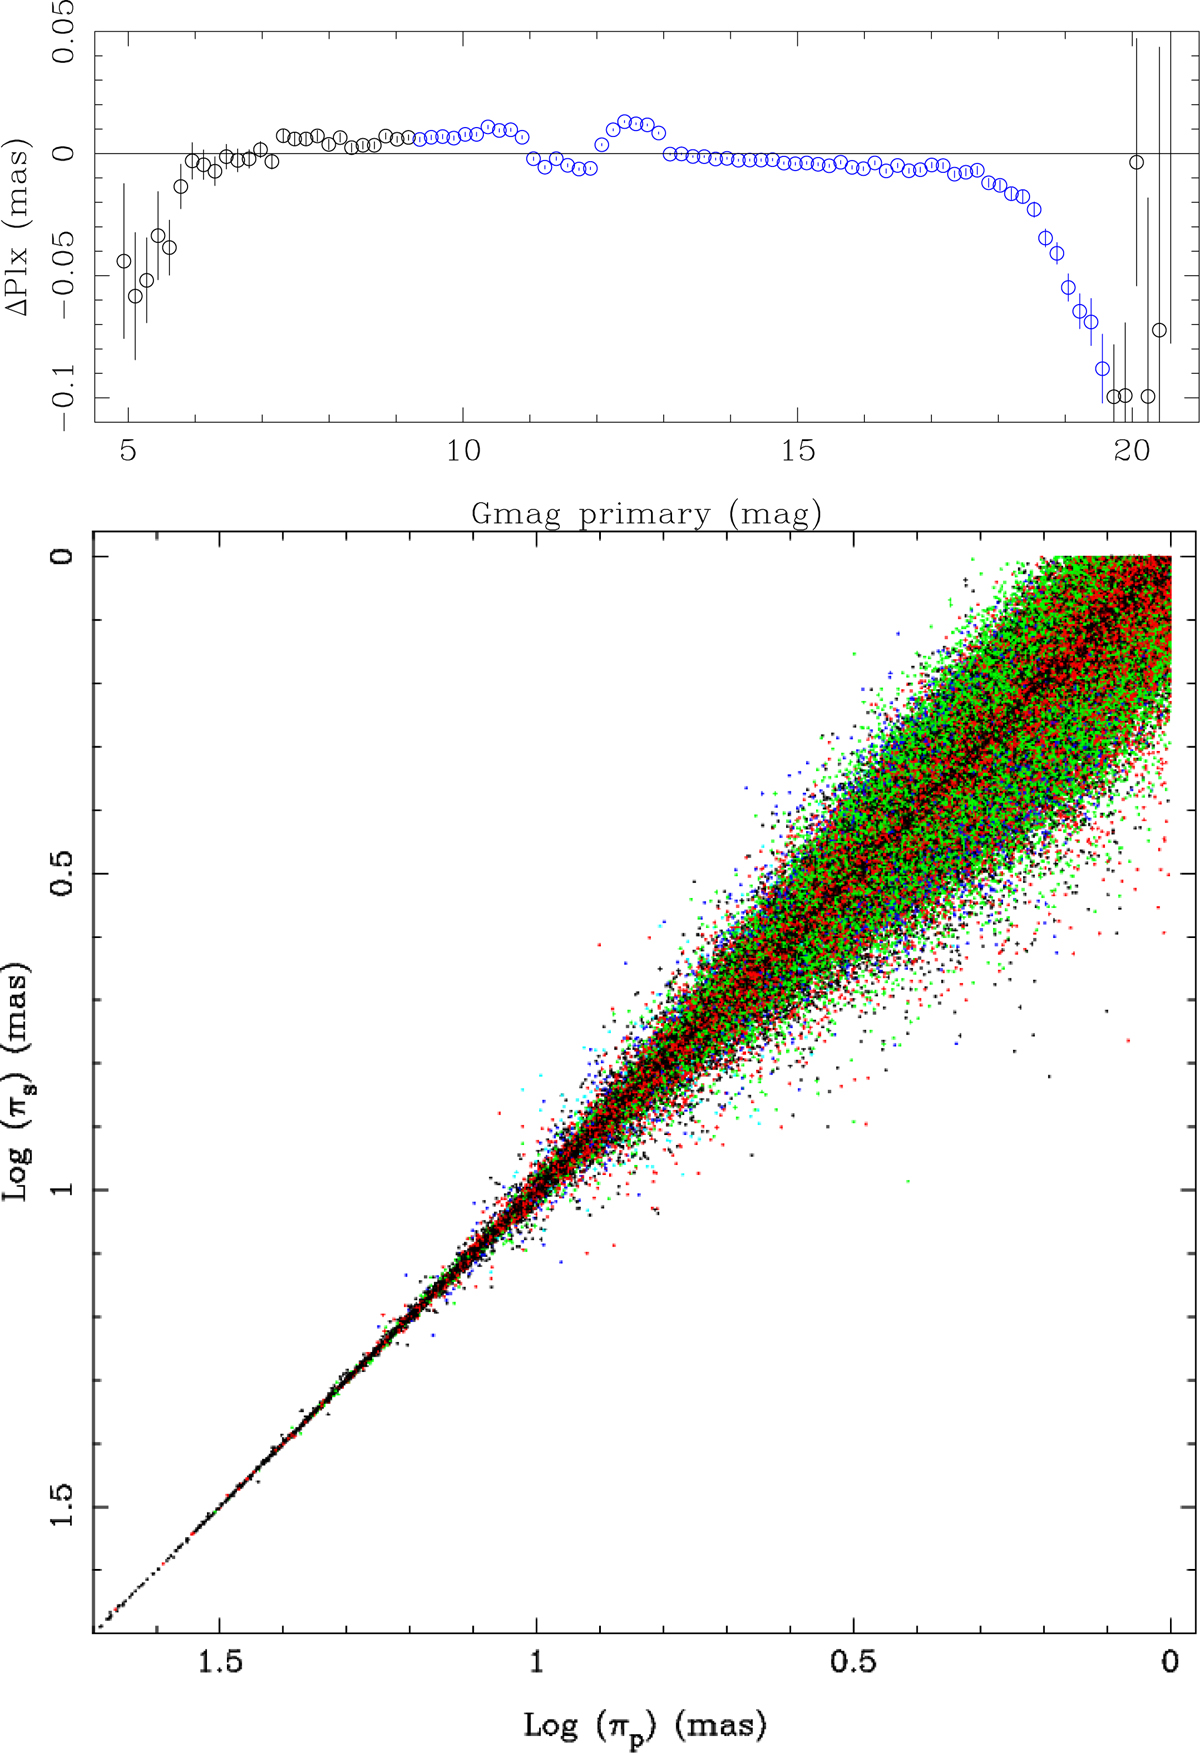
Fig. 5.
Download original image
Top panel: parallax difference between the primary and secondary components in wide binaries as a function of primary G magnitude. Bins with more than 1000 objects are plotted in blue. Bottom panel: parallax of the secondary binary component plotted against that of the primary. Objects with primary G magnitude larger than 5, 15, 17, 19, and 20 mag are plotted as black, red, green, dark blue, and light blue dots, respectively. About 590 000 binaries are plotted where both components pass the criteria on GOF and RUWE.
Current usage metrics show cumulative count of Article Views (full-text article views including HTML views, PDF and ePub downloads, according to the available data) and Abstracts Views on Vision4Press platform.
Data correspond to usage on the plateform after 2015. The current usage metrics is available 48-96 hours after online publication and is updated daily on week days.
Initial download of the metrics may take a while.