Fig. 3.
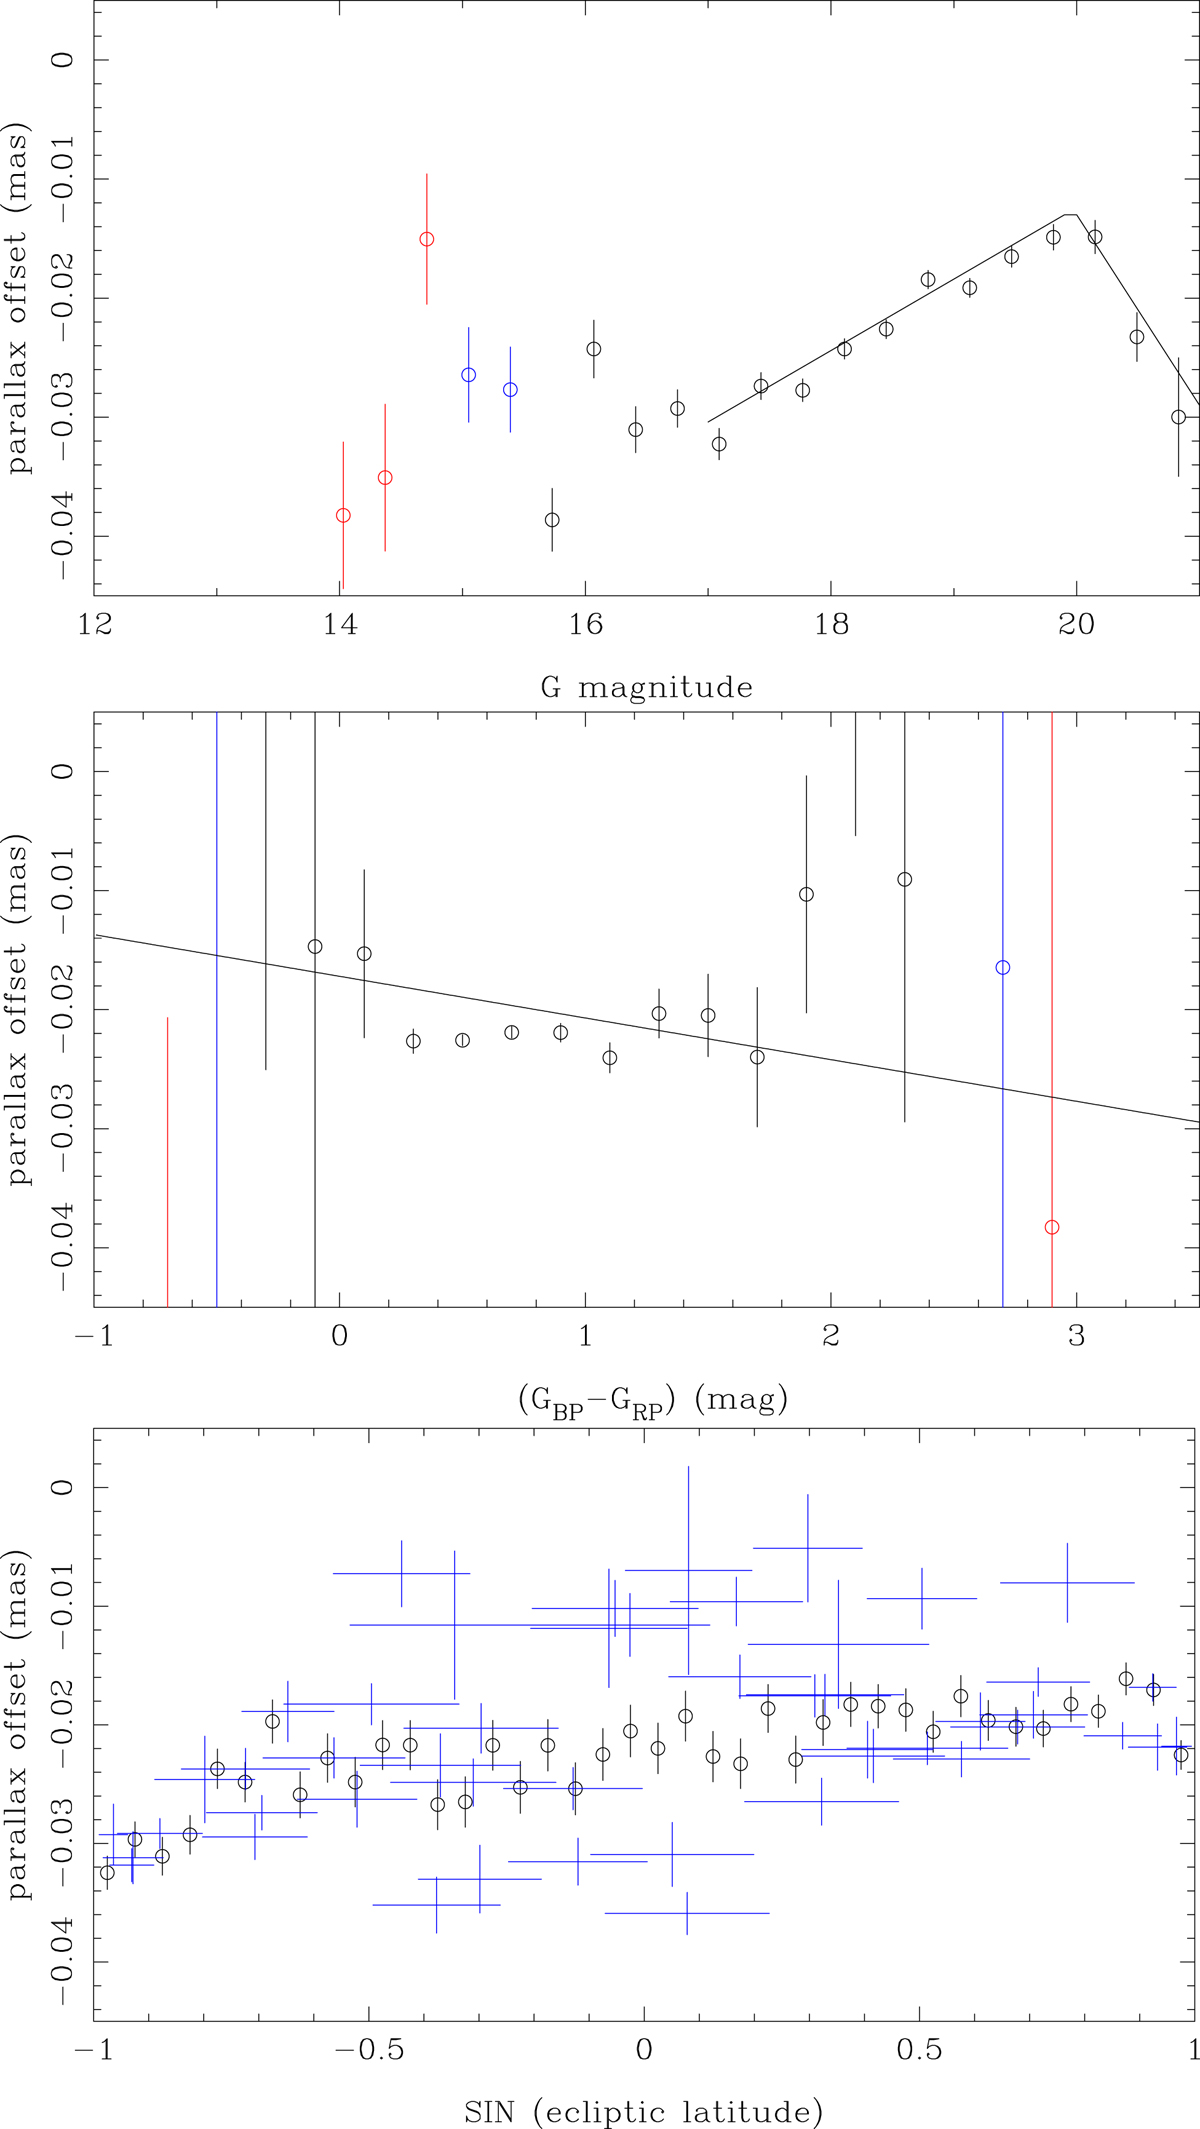
Download original image
PZPO for the QSO sample as a function of G, (GBP − GRP) colour and ecliptic latitude (open circles). Only bins with ≥5 objects are plotted. Bins with 100 objects or less are plotted in blue, with 30 objects or less in red. The lines in the top panel and the lines in the middle panel are not a fit to the data, but are based on Eq. (5). The blue points in the lower panel indicate the PZPO for the 48 HEALPix level 1 pixels. The horizontal bar gives the range in sin β for each HEALPix pixel.
Current usage metrics show cumulative count of Article Views (full-text article views including HTML views, PDF and ePub downloads, according to the available data) and Abstracts Views on Vision4Press platform.
Data correspond to usage on the plateform after 2015. The current usage metrics is available 48-96 hours after online publication and is updated daily on week days.
Initial download of the metrics may take a while.