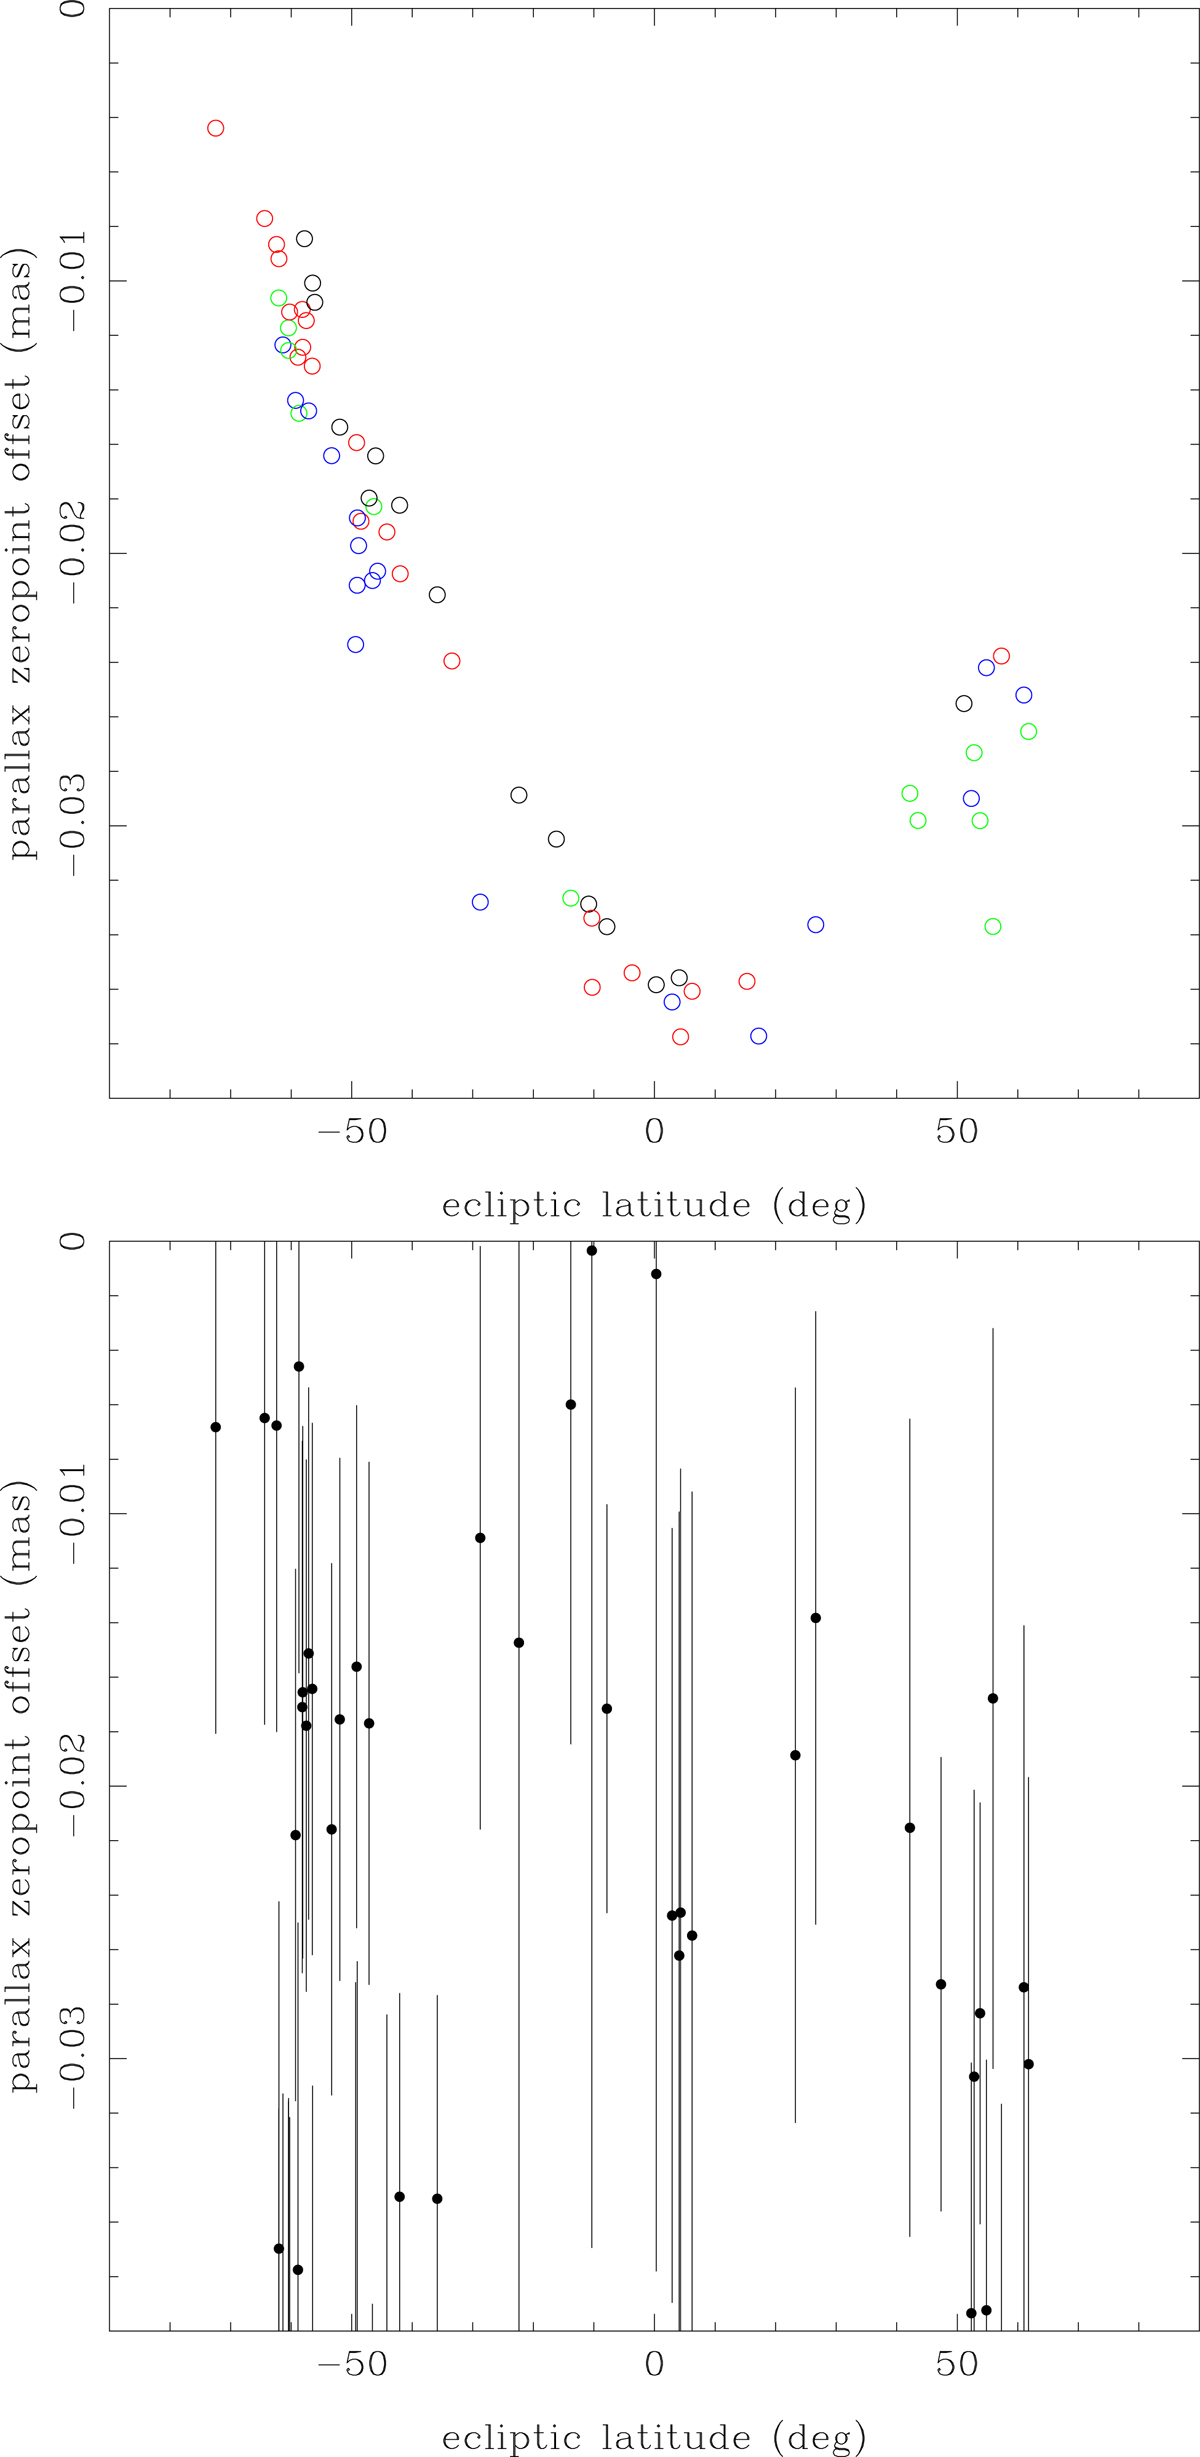
Fig. 11.
Download original image
Top panel: PZPO correction by L20 for the sample of 66 CCs analysed by Riess et al. (2021) (cf. their Fig. 2). The colours represent different ranges in G: black (G ≤ 7), red (7 < G ≤ 8.5), green (8.5 < G ≤ 9.0), and blue (9 < G ≤ 11.5). Bottom panel: correction proposed here for the stricter selected sample of 54 stars at HEALPix level 2.
Current usage metrics show cumulative count of Article Views (full-text article views including HTML views, PDF and ePub downloads, according to the available data) and Abstracts Views on Vision4Press platform.
Data correspond to usage on the plateform after 2015. The current usage metrics is available 48-96 hours after online publication and is updated daily on week days.
Initial download of the metrics may take a while.