Fig. A.1
Download original image
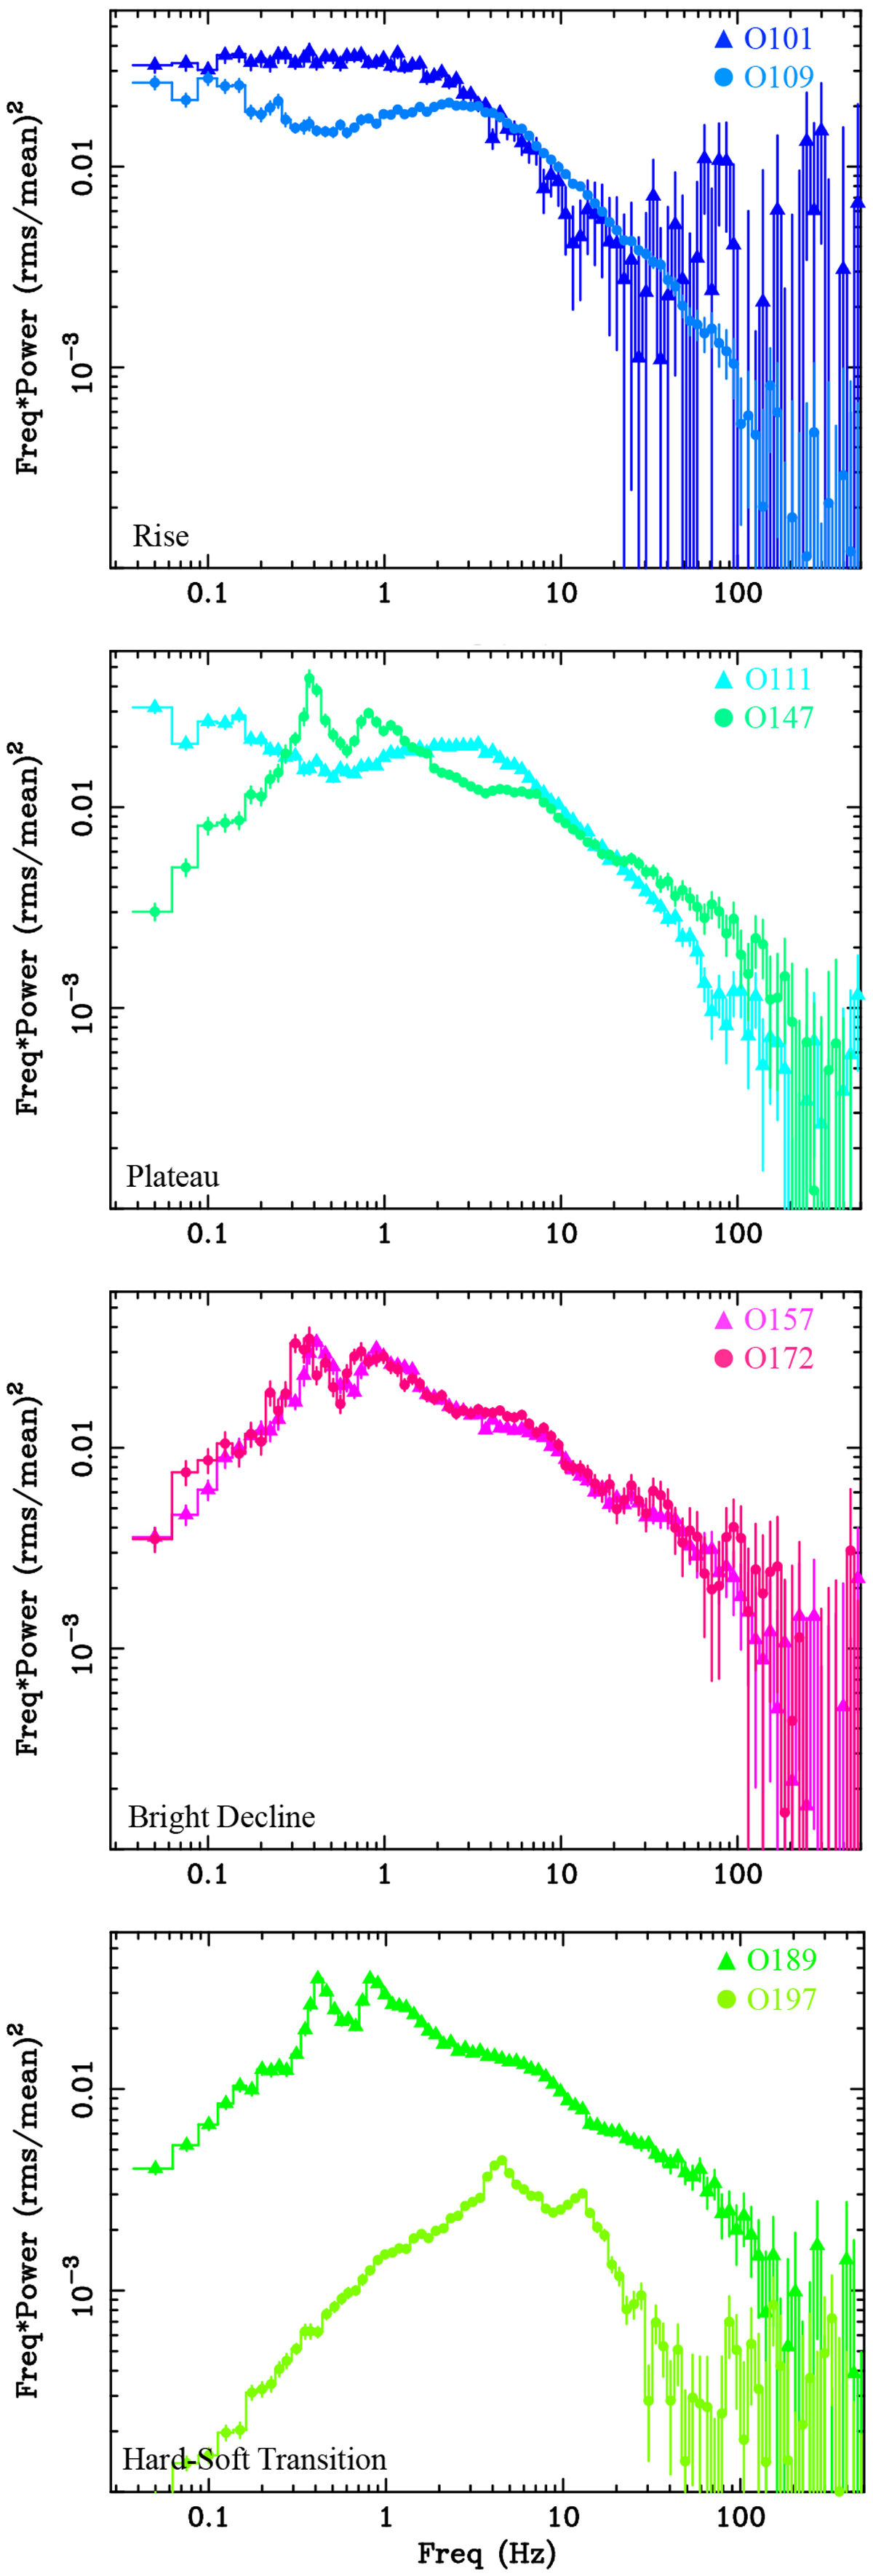
Selection of PSDs of MAXI J1820+070 during different phases (colour-coded according to Fig. 1 and reported in the labels) of the first part of the 2018 outburst (two examples are shown for each phase). The PSDs are extracted inthe energy band 2–11 keV and reveal a strong and complex evolution of the X-ray timing properties of the source.
Current usage metrics show cumulative count of Article Views (full-text article views including HTML views, PDF and ePub downloads, according to the available data) and Abstracts Views on Vision4Press platform.
Data correspond to usage on the plateform after 2015. The current usage metrics is available 48-96 hours after online publication and is updated daily on week days.
Initial download of the metrics may take a while.