Fig. 4
Download original image
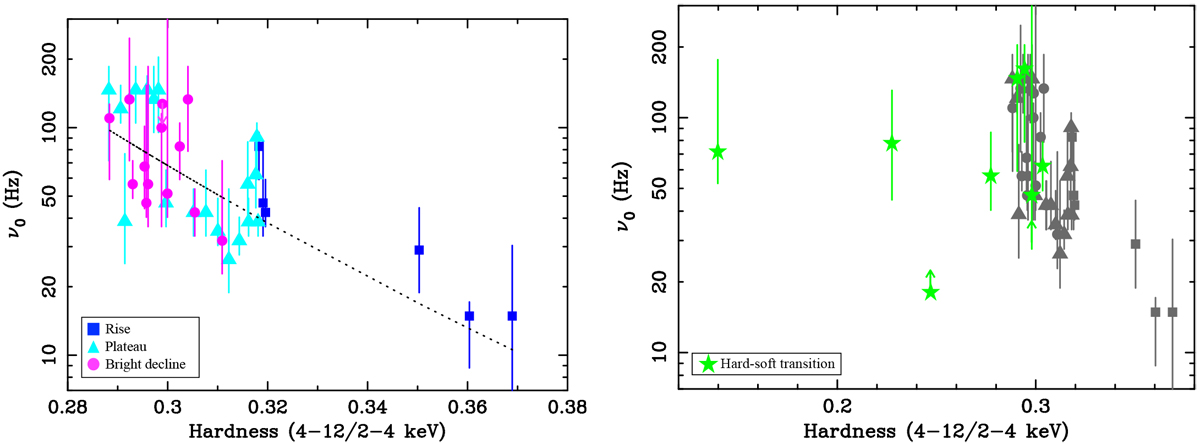
Evolution of ν0 in lag-frequency spectra as a function of spectral hardness. Left panel: results from the rise, plateau, and bright decline phases, which are observed to follow the same trend. The dotted black line is the best-fit model. Right panel: results from the hard-soft transition phase as compared to the other phases (grey symbols), which is observed to break from the observed trend at higher spectral hardness.The arrows are 90 per cent lower and upper limits.
Current usage metrics show cumulative count of Article Views (full-text article views including HTML views, PDF and ePub downloads, according to the available data) and Abstracts Views on Vision4Press platform.
Data correspond to usage on the plateform after 2015. The current usage metrics is available 48-96 hours after online publication and is updated daily on week days.
Initial download of the metrics may take a while.