Fig. 3
Download original image
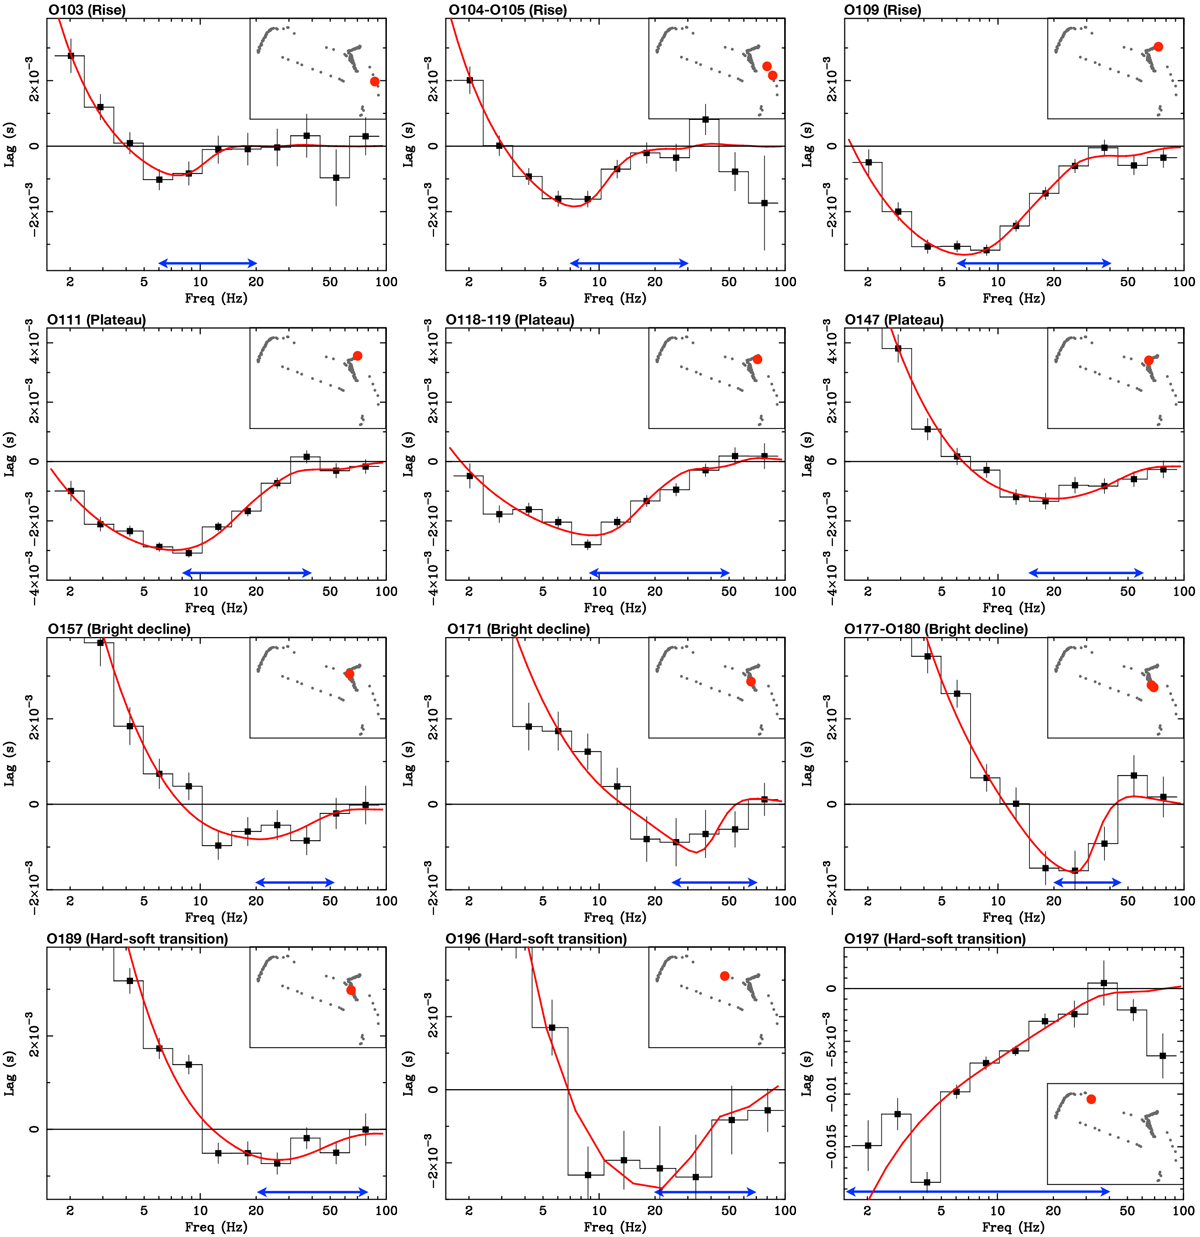
0.5–1 vs. 2–5 keV lag-frequency spectra of selected observations of MAXI J1820+070. The observations illustrate the diverse behaviour of soft (negative) lags during different phases of the outburst (as also reported in the insets). The solid red curve is the best-fit RELTRANS model. The blue arrow marks the frequency range used for the extraction of covariance spectra.
Current usage metrics show cumulative count of Article Views (full-text article views including HTML views, PDF and ePub downloads, according to the available data) and Abstracts Views on Vision4Press platform.
Data correspond to usage on the plateform after 2015. The current usage metrics is available 48-96 hours after online publication and is updated daily on week days.
Initial download of the metrics may take a while.