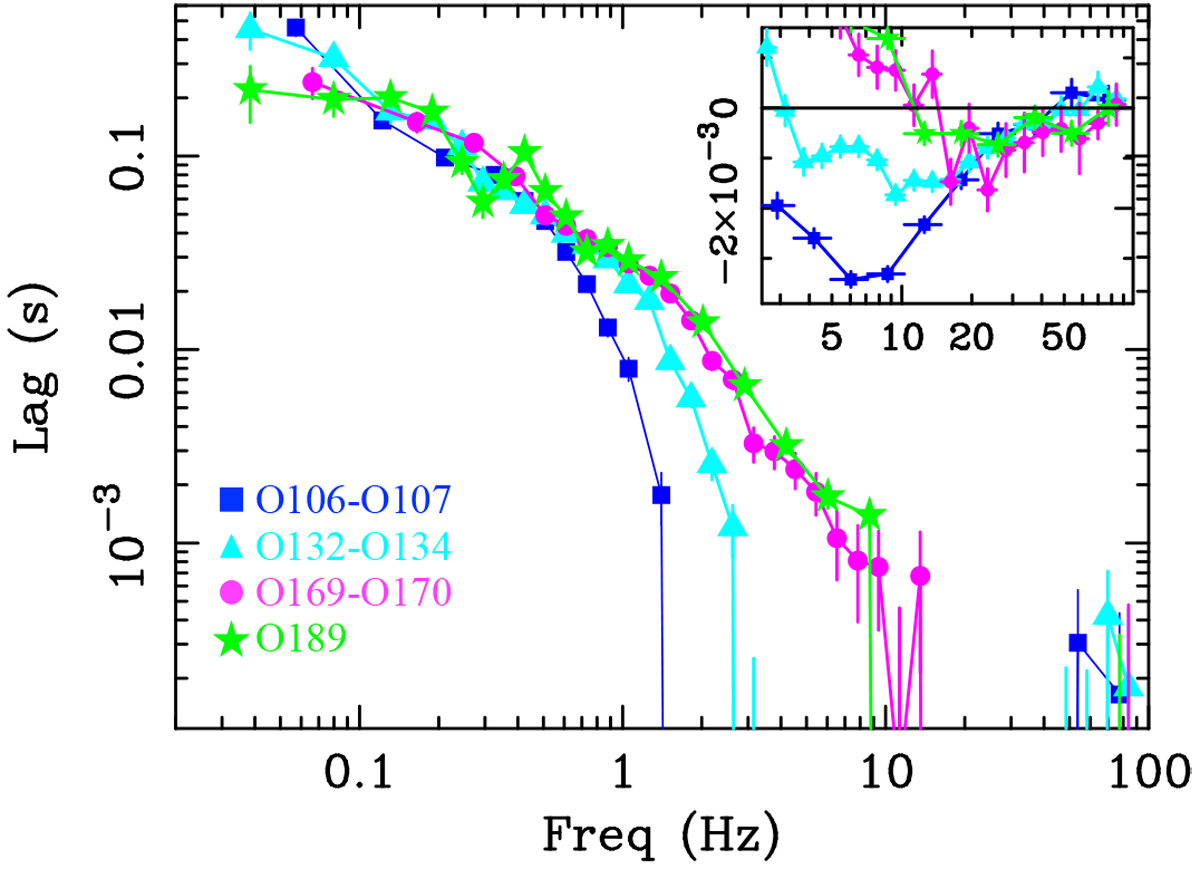
Fig. 2
Download original image
0.5–1 keV vs. 2–5 keV lag-frequency spectrum of some of the analysed observations of MAXI J1820+070 during the rise, plateau, bright decline, and hard-soft transition phases (with colour codes and symbols as in Fig. 1). The positive lags dominating at low frequencies (≲2 Hz) are hard X-ray lags. The plot illustrates the hump-like structures characterising these low-frequency hard lags and their complex evolution throughout the first part of the outburst. At high frequencies (≳2 Hz) the (negative) soft X-ray lag becomes dominant (see inset, with the y axis in linear scale).
Current usage metrics show cumulative count of Article Views (full-text article views including HTML views, PDF and ePub downloads, according to the available data) and Abstracts Views on Vision4Press platform.
Data correspond to usage on the plateform after 2015. The current usage metrics is available 48-96 hours after online publication and is updated daily on week days.
Initial download of the metrics may take a while.