Fig. B.2
Download original image
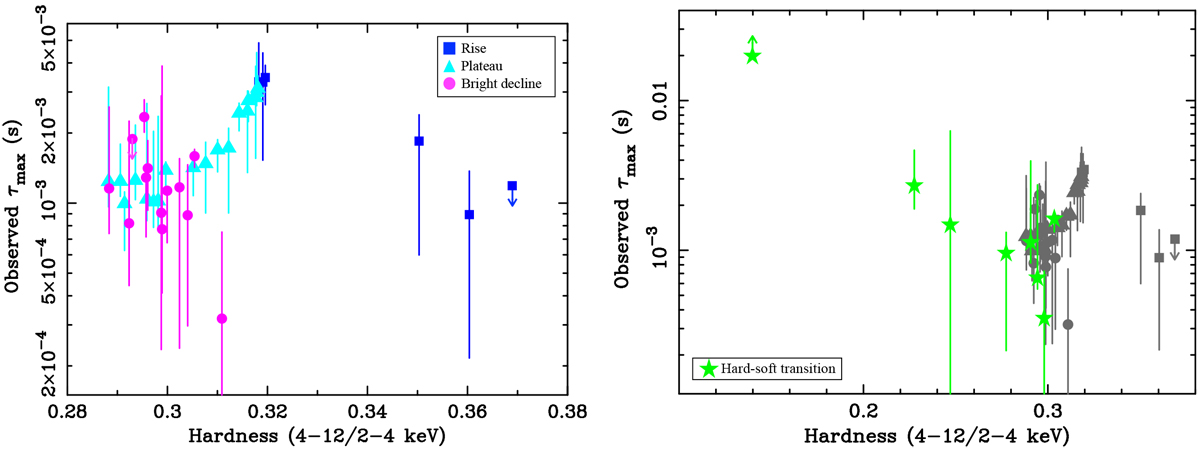
Evolution of observed maximum soft lag amplitude (as inferred from the best-fit models) in lag-frequency spectra as a function of spectral hardness. For comparison with Fig. 4, the left panel reports results from the rise, plateau, andbright decline phases, while the right panel reports results from the hard-soft transition phase as compared to the other phases (grey symbols).
Current usage metrics show cumulative count of Article Views (full-text article views including HTML views, PDF and ePub downloads, according to the available data) and Abstracts Views on Vision4Press platform.
Data correspond to usage on the plateform after 2015. The current usage metrics is available 48-96 hours after online publication and is updated daily on week days.
Initial download of the metrics may take a while.