Fig. B.1

Download original image
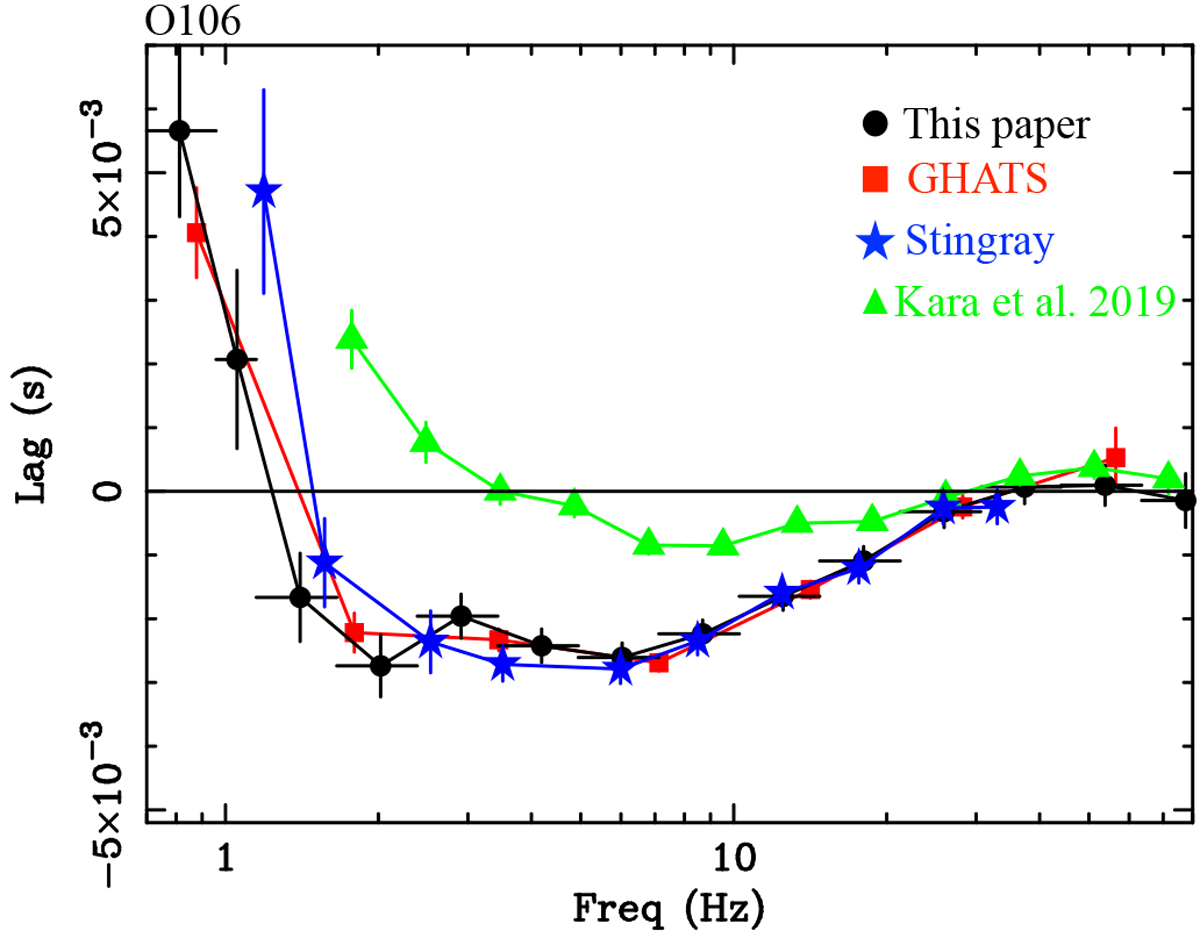
Lag-frequency spectrum of observation O106 between energy bands 0.5–1 keV and 1–10 keV independently computed with the code used in this paper (implemented in IDL and used e.g. in De Marco et al. 2015b, 2017), with the GeneralHigh-Energy Aperiodic Timing Software (GHATS; used e.g. in Belloni et al. 2005), and with Stingray (developed by Huppenkothen et al. 2019a,b and publicly available). The scatter in the data is due to slight differences in the extraction and binning. These lags are compared to those reported in Kara et al. (2019) for the same observation.
Current usage metrics show cumulative count of Article Views (full-text article views including HTML views, PDF and ePub downloads, according to the available data) and Abstracts Views on Vision4Press platform.
Data correspond to usage on the plateform after 2015. The current usage metrics is available 48-96 hours after online publication and is updated daily on week days.
Initial download of the metrics may take a while.


