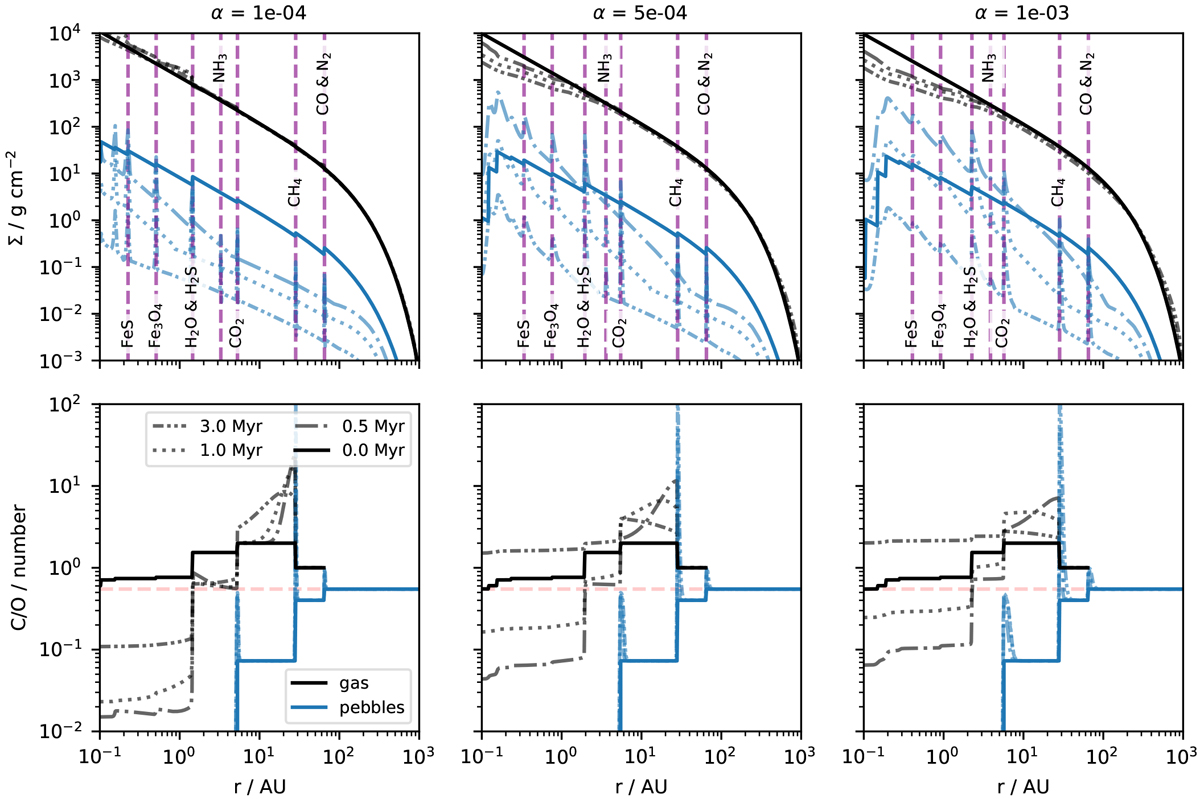
Fig. 3
Download original image
Like Fig. 2 but now including the time evolution of the disk, also for α = 10−4 (left) and α = 10−3 (right). Evaporation line positions are shown with vertical lines, which are different for the different simulations due to an increase in viscous heating with increasing α (Appendix B). We use the same disk parameters (except α) as in Fig. 2, corresponding to the standard parameters shown in Table 3.
Current usage metrics show cumulative count of Article Views (full-text article views including HTML views, PDF and ePub downloads, according to the available data) and Abstracts Views on Vision4Press platform.
Data correspond to usage on the plateform after 2015. The current usage metrics is available 48-96 hours after online publication and is updated daily on week days.
Initial download of the metrics may take a while.