Fig. 2
Download original image
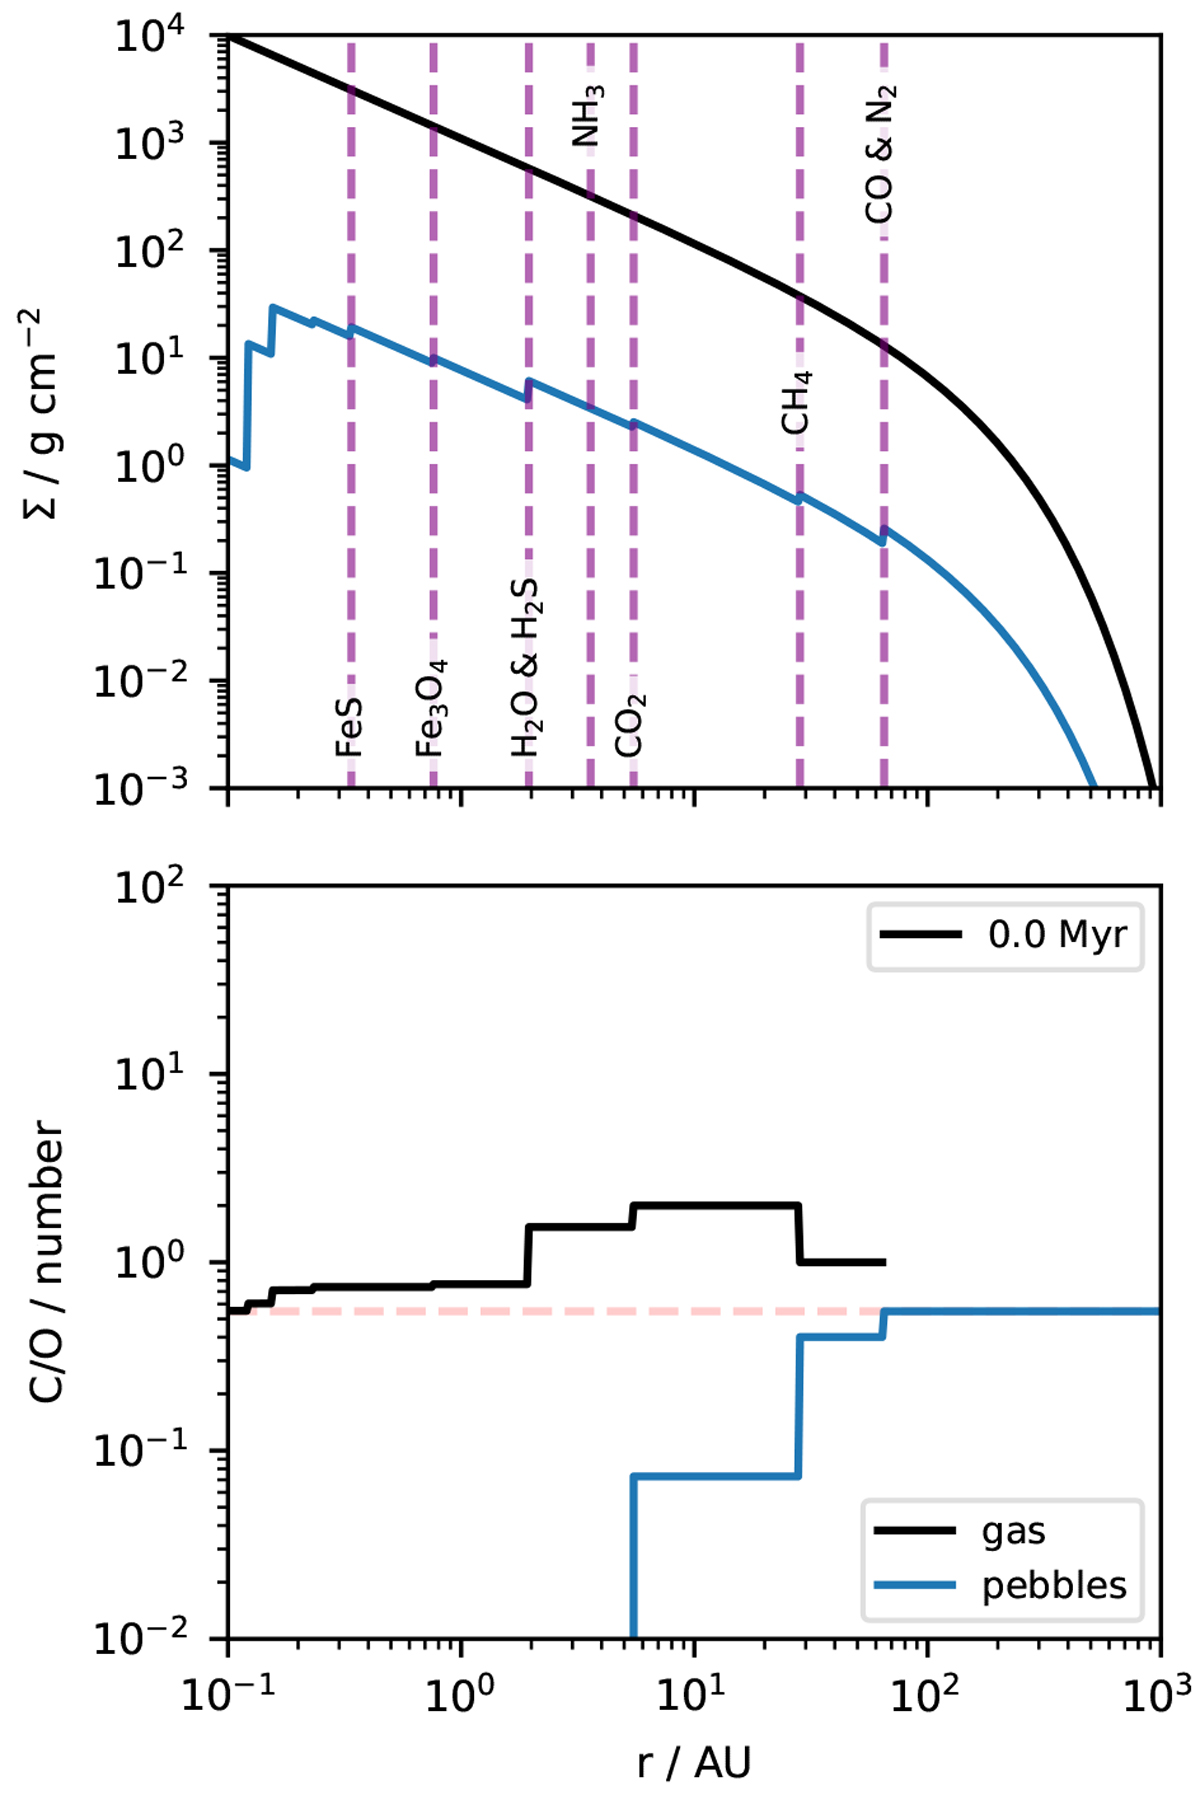
Initial surface density and C/O ratio. Top: initial surface density of pebbles (blue line) and gas (black line). Bottom: C/O number ratio in the disk in pebbles and gas. Evaporation lines are labeled and indicated as dashed purple lines. Evaporation lines for molecular species with condensation temperatures higher than 704 K are not shown for simplicity (see Table 2). The solar C/O value of 0.54 is indicated as a red horizontal dashed line. We use our standard disk parameters with α = 5 × 10⁻⁴ for this simulation, as stated in Table 3.
Current usage metrics show cumulative count of Article Views (full-text article views including HTML views, PDF and ePub downloads, according to the available data) and Abstracts Views on Vision4Press platform.
Data correspond to usage on the plateform after 2015. The current usage metrics is available 48-96 hours after online publication and is updated daily on week days.
Initial download of the metrics may take a while.