Fig. 11
Download original image
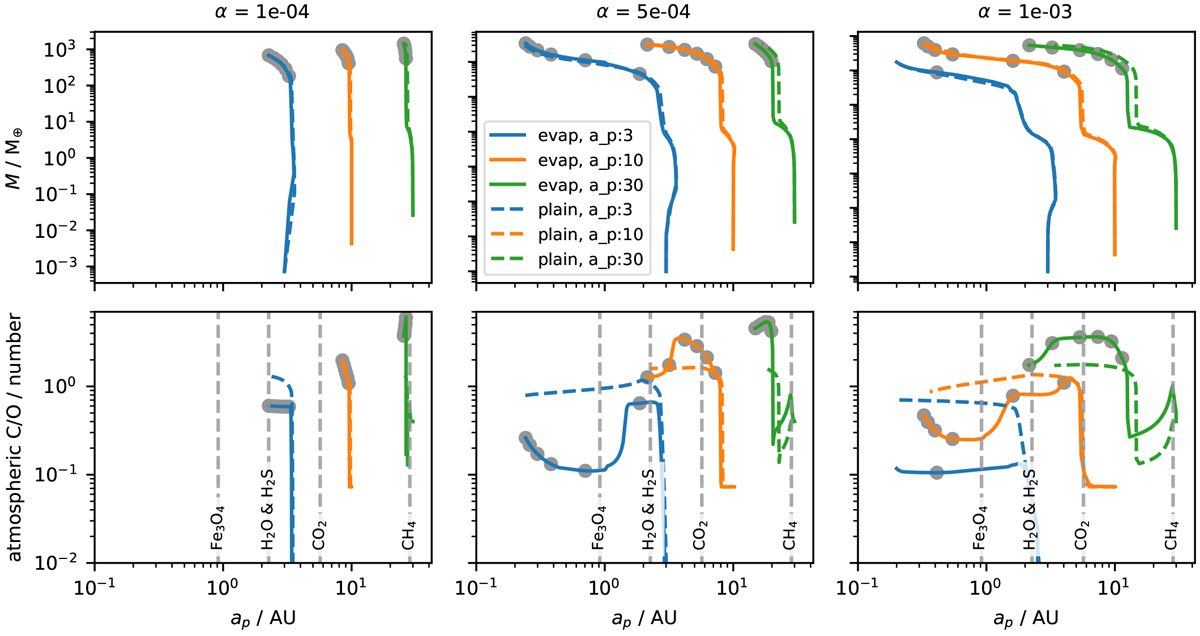
Evolution of planets that accrete pebbles and gas starting at different initial positions. Top: growth tracks displaying the planetary mass as a function of its position. The dashed line indicates planets that grow in disks with a static composition model (see Sect. 2.2), while the solid lines include the evaporation of pebbles at the evaporation lines. Bottom: atmospheric C/O content of the same planets as a function of their position. The dashed gray lines mark the positions of evaporation lines. The gray dots mark time steps of 0.5 Myr. We use here our standard parameters as stated in Table 3, corresponding to the disk evolution shown in Fig. 3, and abbreviations of the labels can be found in Table 4.
Current usage metrics show cumulative count of Article Views (full-text article views including HTML views, PDF and ePub downloads, according to the available data) and Abstracts Views on Vision4Press platform.
Data correspond to usage on the plateform after 2015. The current usage metrics is available 48-96 hours after online publication and is updated daily on week days.
Initial download of the metrics may take a while.