Free Access
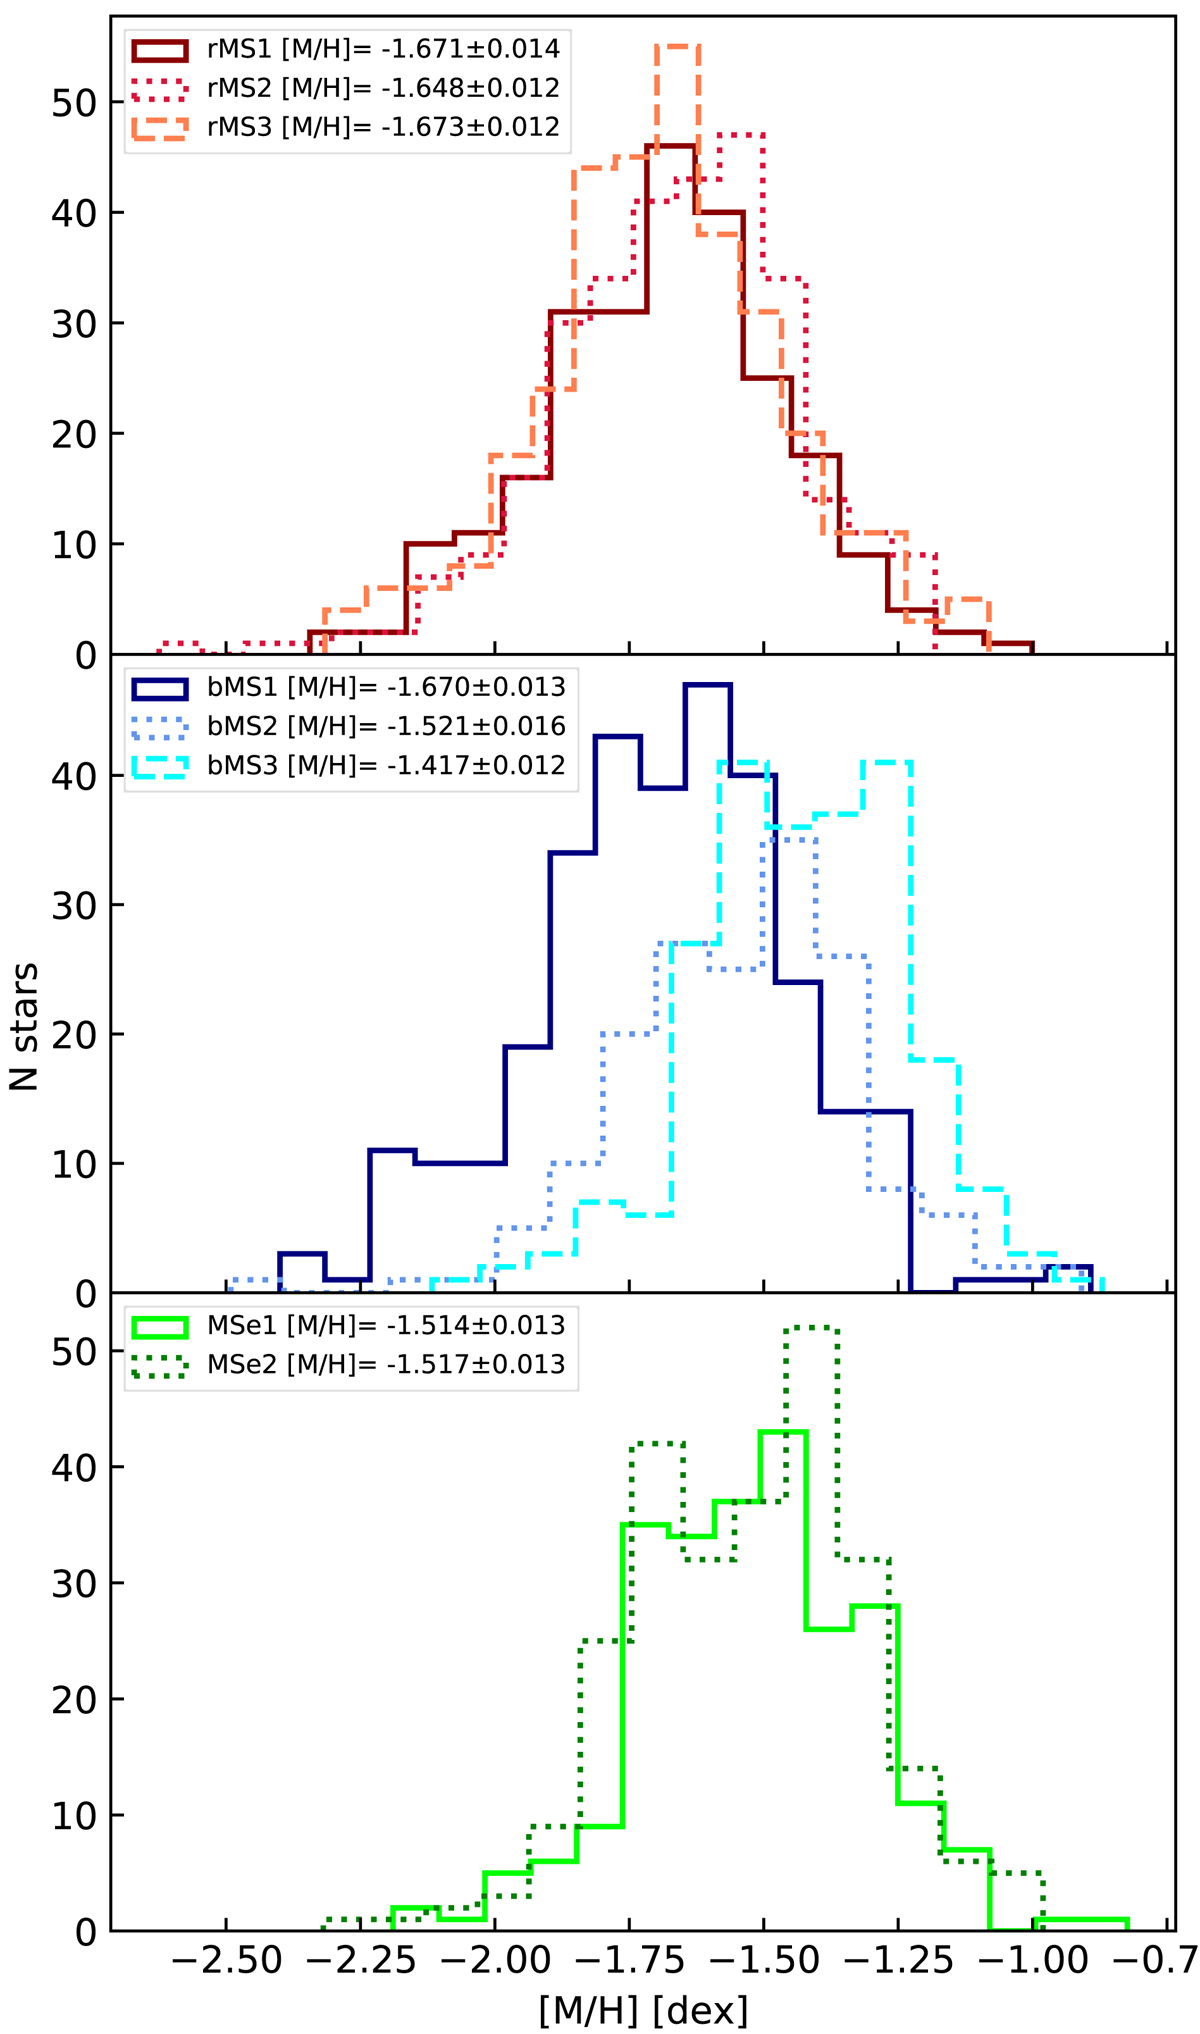
Fig. C.1.
Download original image
Metallicity distributions of the subpopulations of rMS and bMS as identified by BE17. For the MSe, we plotted the distributions for the two most populous groups: MSe1 and MSe2.
Current usage metrics show cumulative count of Article Views (full-text article views including HTML views, PDF and ePub downloads, according to the available data) and Abstracts Views on Vision4Press platform.
Data correspond to usage on the plateform after 2015. The current usage metrics is available 48-96 hours after online publication and is updated daily on week days.
Initial download of the metrics may take a while.