Free Access
Fig. 6
Download original image
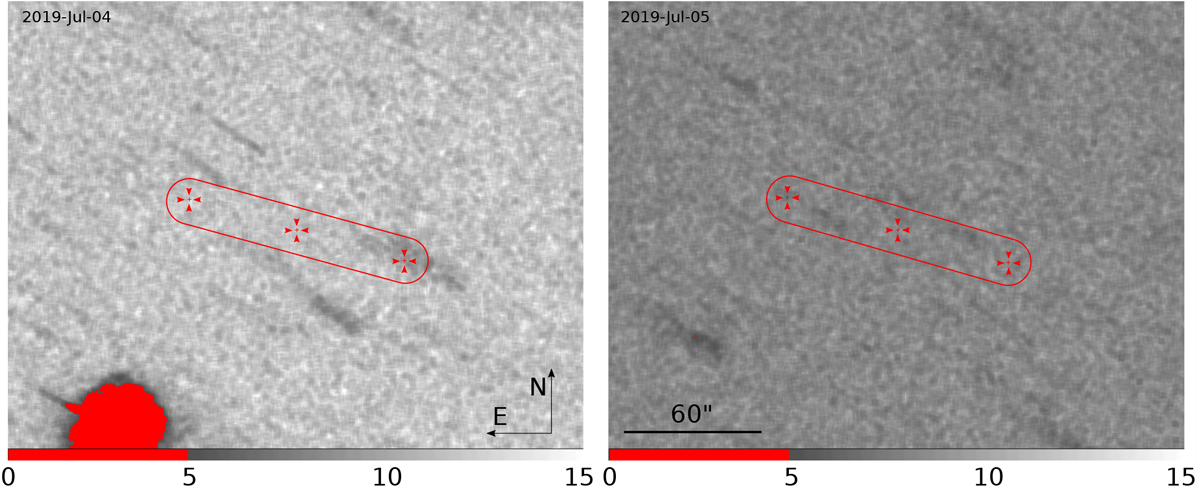
Map of the expected S/N of the VI at its lowest magnitude 26. The regions where this S/Nis below 5 are shaded in red. The zone of interest is indicated by a red contour 10″ around the virtual impactors; the positions of the central VI and the eastern- and westernmost VIs are indicated.
Current usage metrics show cumulative count of Article Views (full-text article views including HTML views, PDF and ePub downloads, according to the available data) and Abstracts Views on Vision4Press platform.
Data correspond to usage on the plateform after 2015. The current usage metrics is available 48-96 hours after online publication and is updated daily on week days.
Initial download of the metrics may take a while.