Fig. 2
Download original image
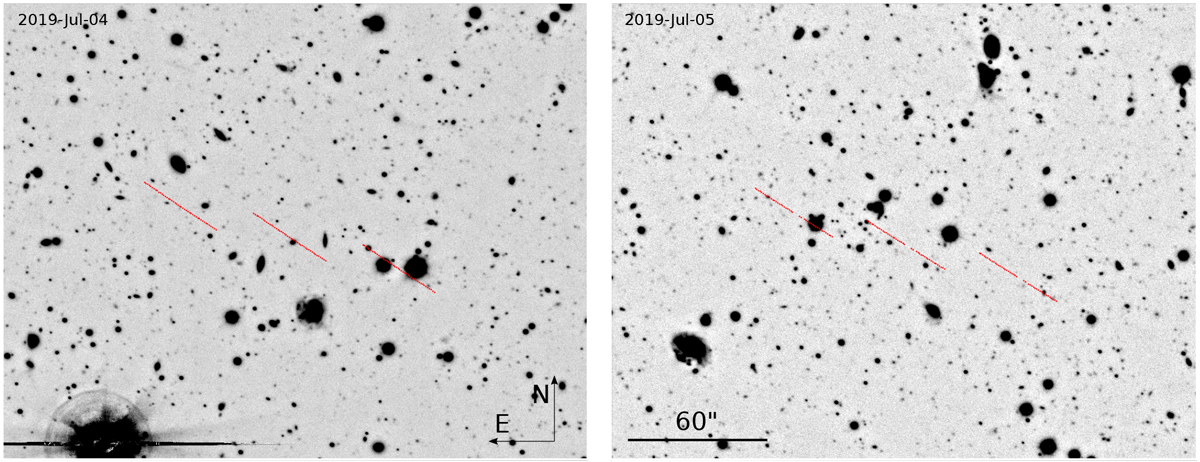
Stack of the images aligned on the stars. The tracks for three VIs from the continuous swarm illustrated in Fig. 1 are indicated. They represent the eastern- and westernmost VIs and the centre of the swarm. Theeastern and western tracks bound the region to be searched. The negative linear grey scale ranges from 2σ below to 15σ above the background.
Current usage metrics show cumulative count of Article Views (full-text article views including HTML views, PDF and ePub downloads, according to the available data) and Abstracts Views on Vision4Press platform.
Data correspond to usage on the plateform after 2015. The current usage metrics is available 48-96 hours after online publication and is updated daily on week days.
Initial download of the metrics may take a while.