Free Access
Fig. 9.
Download original image
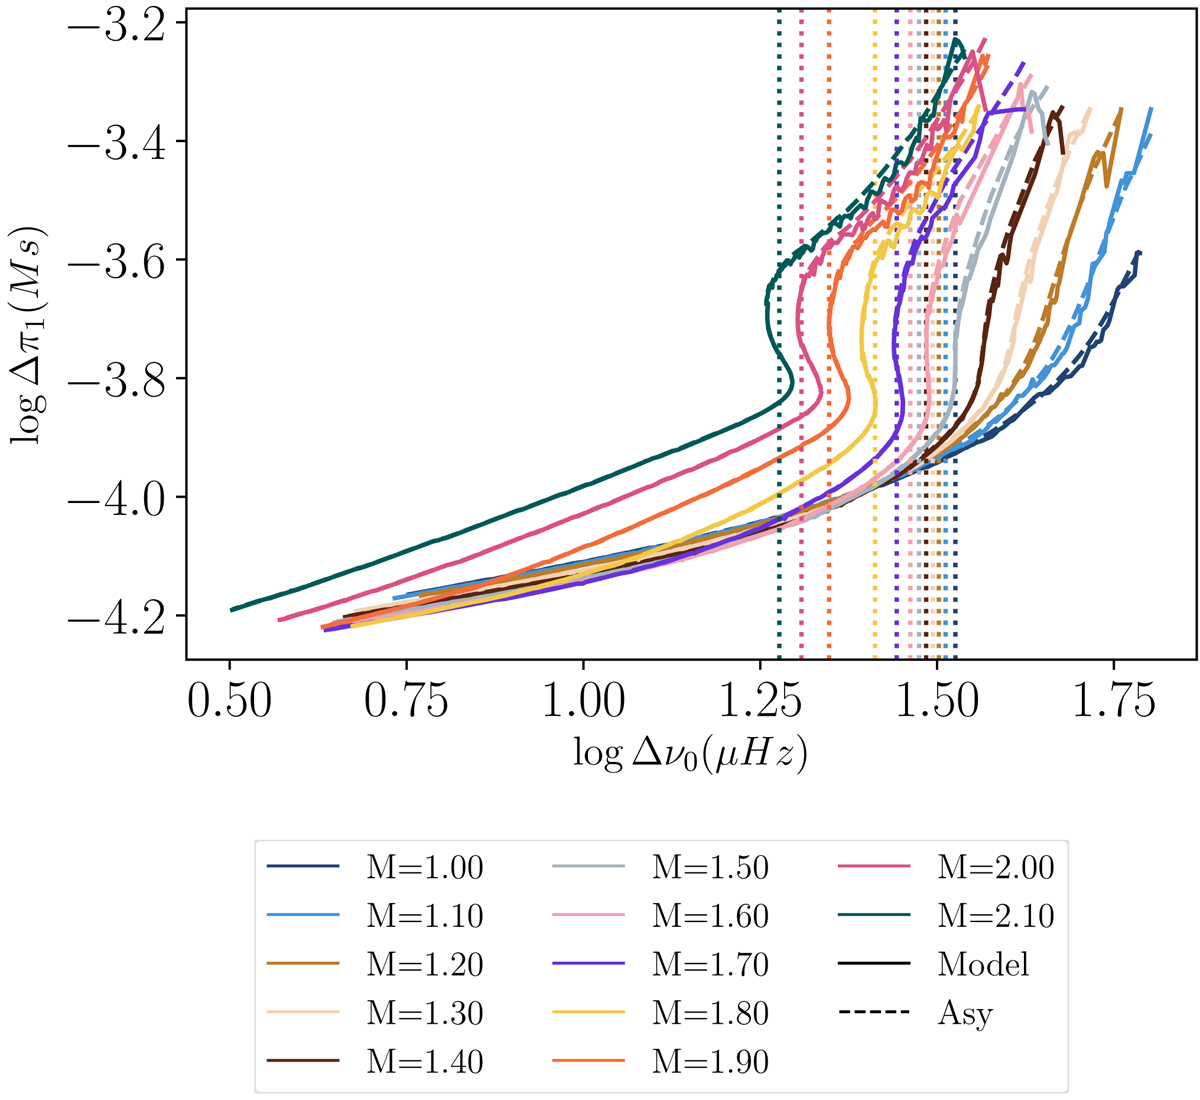
Variation of Δπ1 with Δν0 for different masses, depicted by the colours. The dashed lines correspond to the asymptotic value. The dotted vertical lines correspond to the transition between subgiant and red-giant phases.
Current usage metrics show cumulative count of Article Views (full-text article views including HTML views, PDF and ePub downloads, according to the available data) and Abstracts Views on Vision4Press platform.
Data correspond to usage on the plateform after 2015. The current usage metrics is available 48-96 hours after online publication and is updated daily on week days.
Initial download of the metrics may take a while.