Fig. A.1.
Download original image
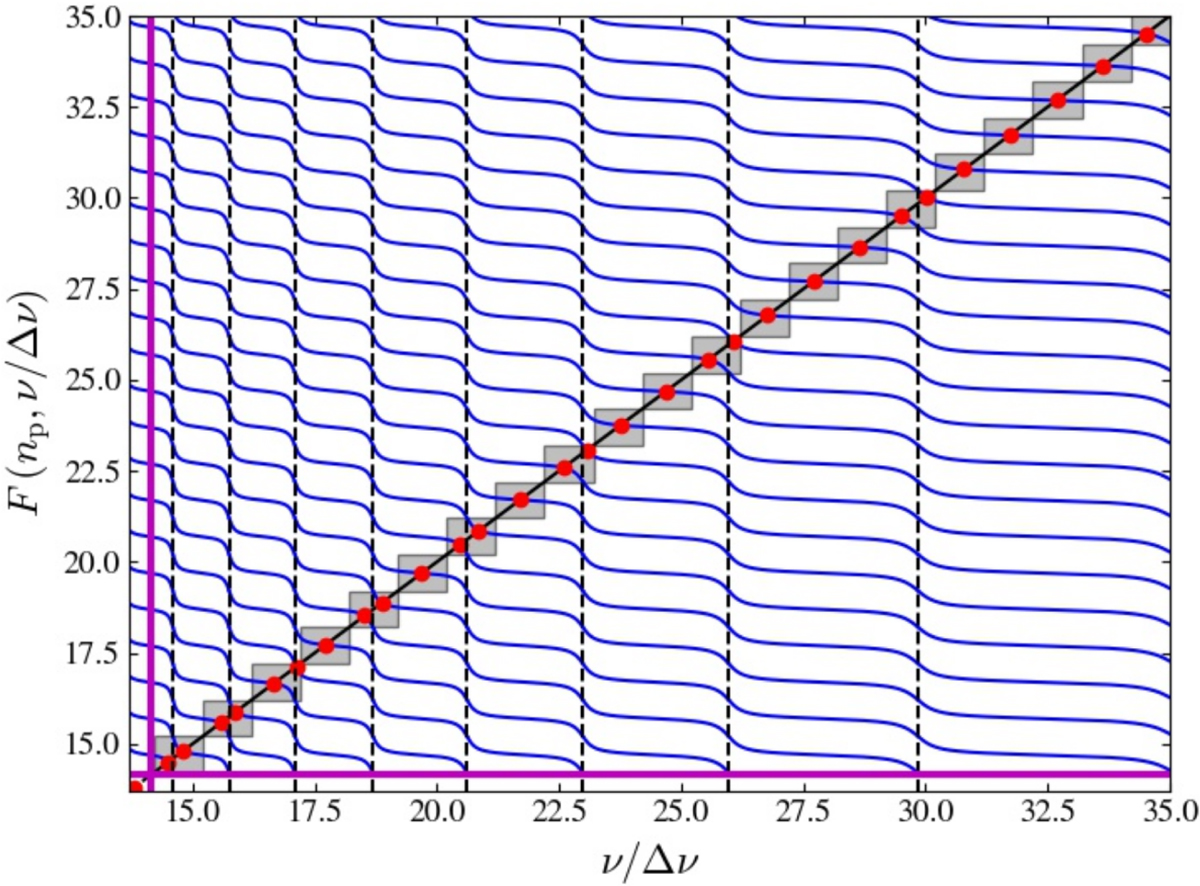
Evolution of the phase function with the frequency over the large speration. The phase function for different pressure radial orders is represented in blue. The straight line represents the identity function f(x) = x. Its intersections with the phase function are the solutions, in red. The grey square domains represent regions of constant np values. The vertical dashed lines are the positions of pure g-modes. The mixed-mode parameters used are q = 0.2 and ΔνΔπ1 = 200
Current usage metrics show cumulative count of Article Views (full-text article views including HTML views, PDF and ePub downloads, according to the available data) and Abstracts Views on Vision4Press platform.
Data correspond to usage on the plateform after 2015. The current usage metrics is available 48-96 hours after online publication and is updated daily on week days.
Initial download of the metrics may take a while.