Free Access
Fig. 1.
Download original image
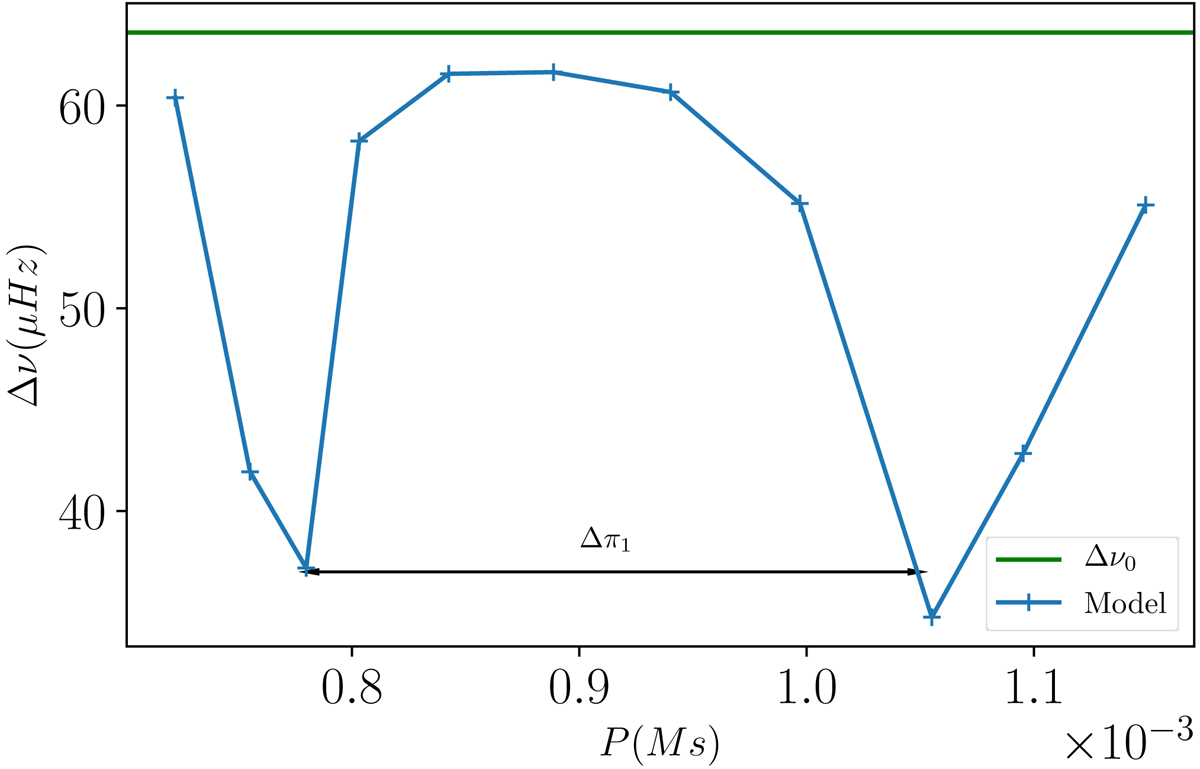
Oscillation frequency differences between consecutive modes as a function of the period in the 1 M⊙ subgiant model presented in Table 1. The green horizontal line represents the large separation value calculated for radial modes. The double-sided arrow shows the approximate asymptotic period spacing.
Current usage metrics show cumulative count of Article Views (full-text article views including HTML views, PDF and ePub downloads, according to the available data) and Abstracts Views on Vision4Press platform.
Data correspond to usage on the plateform after 2015. The current usage metrics is available 48-96 hours after online publication and is updated daily on week days.
Initial download of the metrics may take a while.