Fig. 6.
Download original image
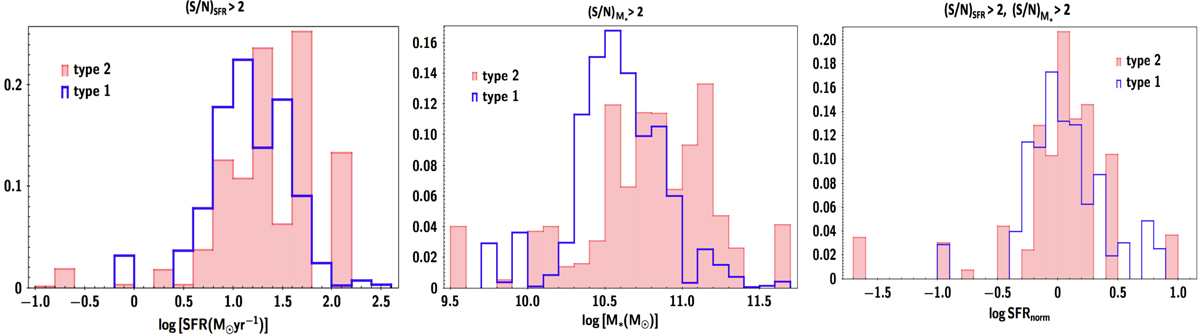
From left to right: star formation rate, stellar mass, and SFRnorm distributions of type 1 (blue lines) and type 2 (red shaded histograms) X-ray selected AGN. The classification is based on optical spectra. We note that SFR and SFRnorm distributions of the two populations are similar. However, type 2 AGN tend to reside in galaxies with stellar mass ∼0.30 dex higher than type 1 AGN (![]() and
and ![]() , respectively). Although, this difference is statistical significant only at ≈1σ, which is in agreement with previous studies.
, respectively). Although, this difference is statistical significant only at ≈1σ, which is in agreement with previous studies.
Current usage metrics show cumulative count of Article Views (full-text article views including HTML views, PDF and ePub downloads, according to the available data) and Abstracts Views on Vision4Press platform.
Data correspond to usage on the plateform after 2015. The current usage metrics is available 48-96 hours after online publication and is updated daily on week days.
Initial download of the metrics may take a while.