Fig. 5.
Download original image
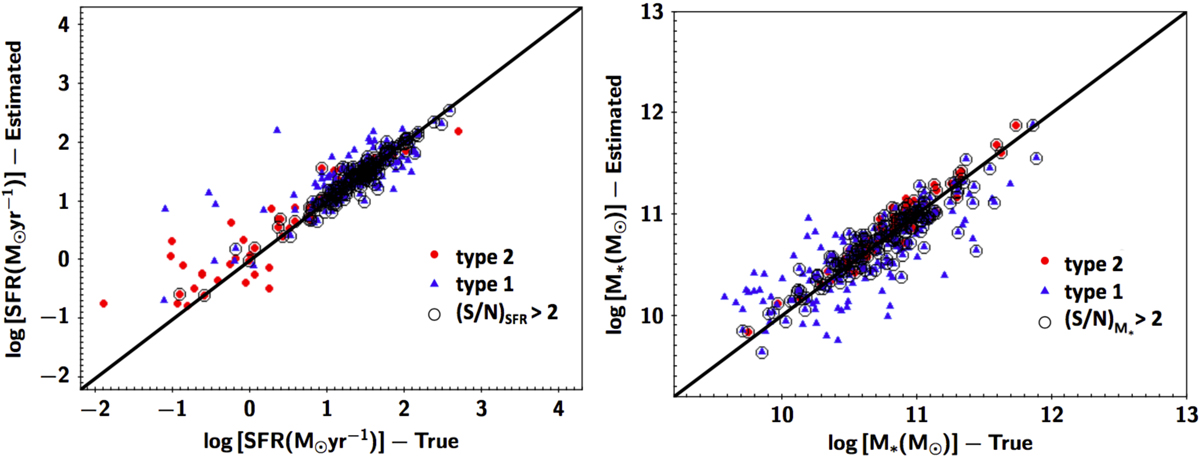
Comparison of the SFR and M* measurements (left and right panel, respectively) for the estimated and true values from the mock analysis. Blue triangles show the results for type 1 X-ray AGN and red circles correspond to type 2 X-ray AGN. Sources are classified based on optical spectra. The black solid line shows the 1:1 relation. Restricting the measurements to those sources with statistical significance, §/N > 2 (open circles), effectively reduces the scatter of the calculations.
Current usage metrics show cumulative count of Article Views (full-text article views including HTML views, PDF and ePub downloads, according to the available data) and Abstracts Views on Vision4Press platform.
Data correspond to usage on the plateform after 2015. The current usage metrics is available 48-96 hours after online publication and is updated daily on week days.
Initial download of the metrics may take a while.