Free Access
Fig. 4.
Download original image
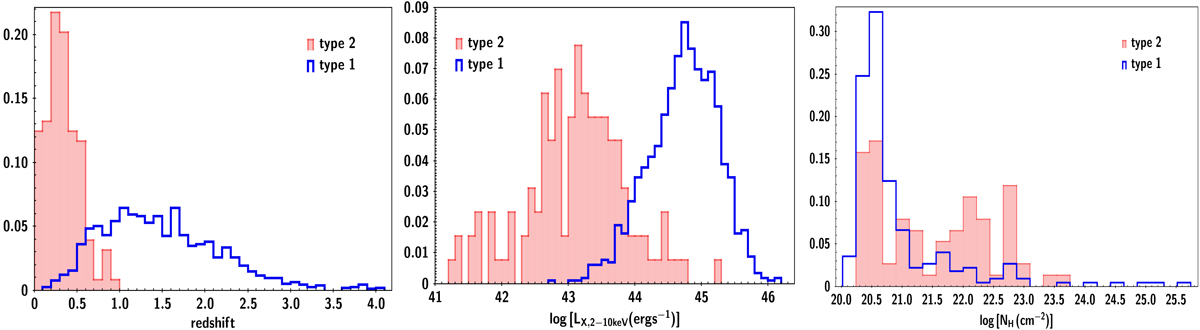
Left and middle panels: redshift and LX distributions of type 1 and 2 AGN, among 1201 X-ray sources in our sample. The classification is based on optical spectra. Right panel: NH distribution for the 284 type 1 and 2 X-ray AGN that lie within the same redshift and LX range.
Current usage metrics show cumulative count of Article Views (full-text article views including HTML views, PDF and ePub downloads, according to the available data) and Abstracts Views on Vision4Press platform.
Data correspond to usage on the plateform after 2015. The current usage metrics is available 48-96 hours after online publication and is updated daily on week days.
Initial download of the metrics may take a while.