Fig. 13.
Download original image
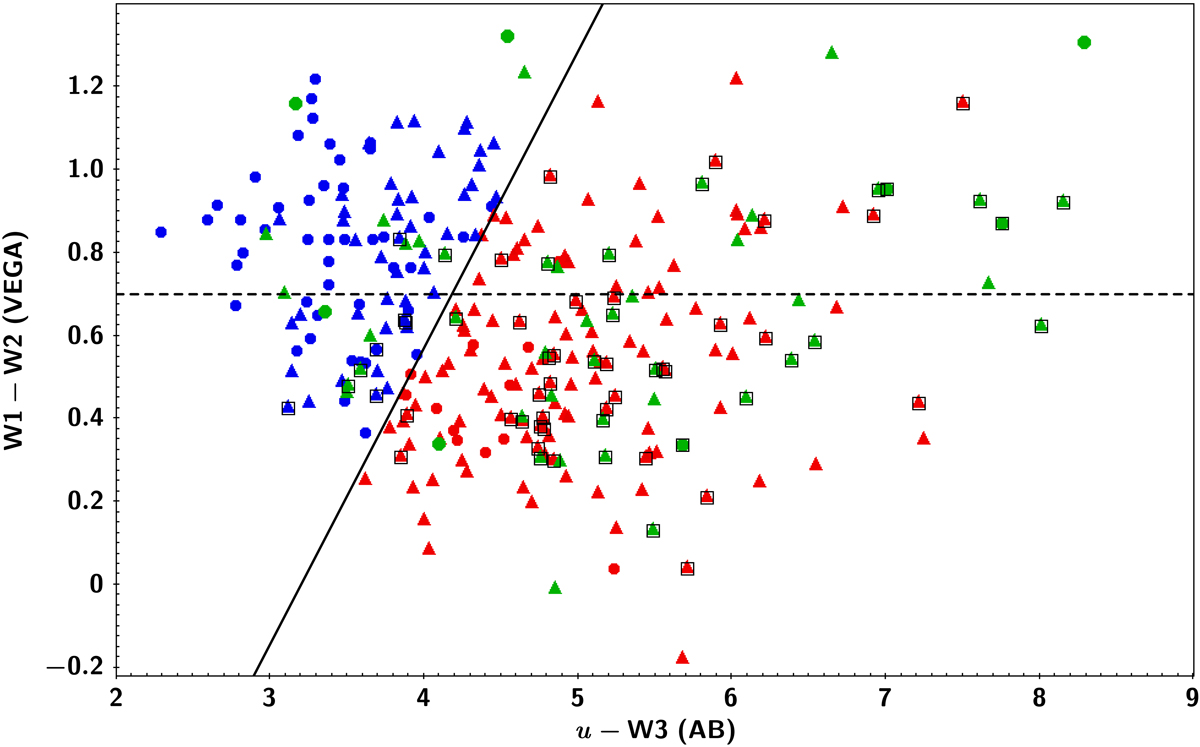
Solid line splits the colour-colour diagram into red and non red AGN, using the Hickox et al. (2017) criterion. The horizontal dashed line indicates the W1 − W2 > 0.7 limit for the selection of IR AGN. Sources classified as optical red are shown in red, while the rest are shown in blue. AGN classified as type 2 from the SED fitting are presented in green. Sources with EB − V > 0.15 are shown with triangles. Sources spectroscopically classified as type 2 are marked by open squares.
Current usage metrics show cumulative count of Article Views (full-text article views including HTML views, PDF and ePub downloads, according to the available data) and Abstracts Views on Vision4Press platform.
Data correspond to usage on the plateform after 2015. The current usage metrics is available 48-96 hours after online publication and is updated daily on week days.
Initial download of the metrics may take a while.