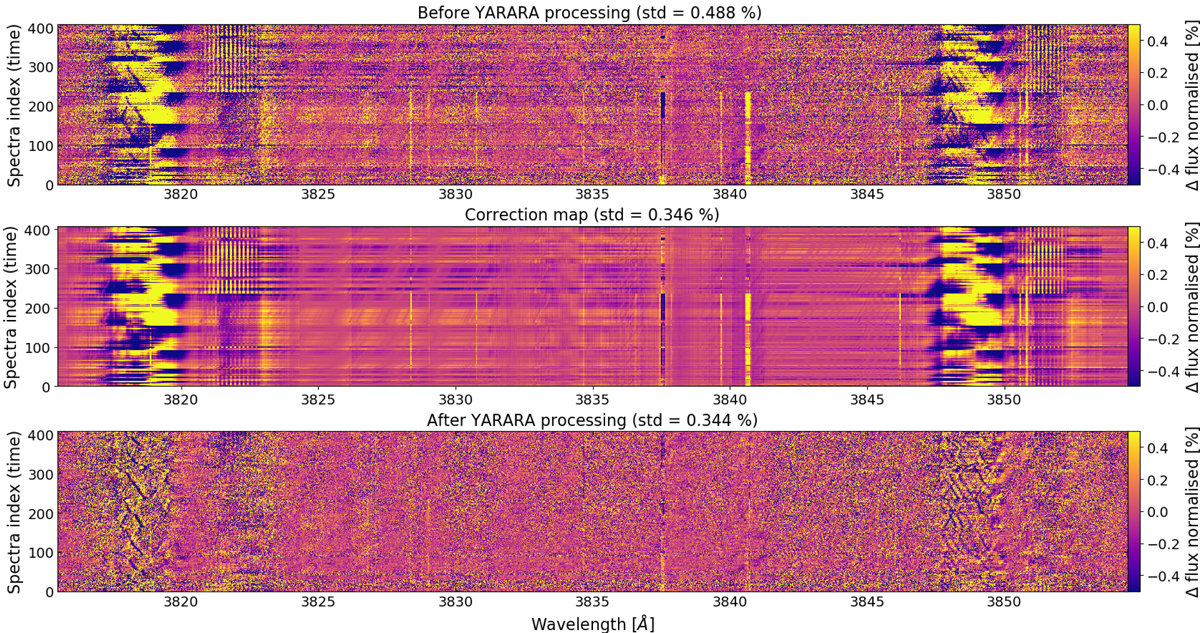
Fig. 6.
Download original image
Ghost, thorium-argon, and continuum corrections performed by YARARA on HD 10700. The river diagram is produced in the BERV rest frame. Top: spectral time series before YARARA corrections. Spectra suffer from thorium-argon contamination (bright vertical lines, for example close to 3840 Å) and Fabry-Pérot contamination by a ghost of the simultaneous calibration fibre (vertical bright comb around 3822 and 3851 Å). The strong contamination around 3819 and 3849 Å is due to two ghosts of the science fibre. Middle: model of the contamination fitted by YARARA. Bottom: residual river diagram after YARARA correction.
Current usage metrics show cumulative count of Article Views (full-text article views including HTML views, PDF and ePub downloads, according to the available data) and Abstracts Views on Vision4Press platform.
Data correspond to usage on the plateform after 2015. The current usage metrics is available 48-96 hours after online publication and is updated daily on week days.
Initial download of the metrics may take a while.