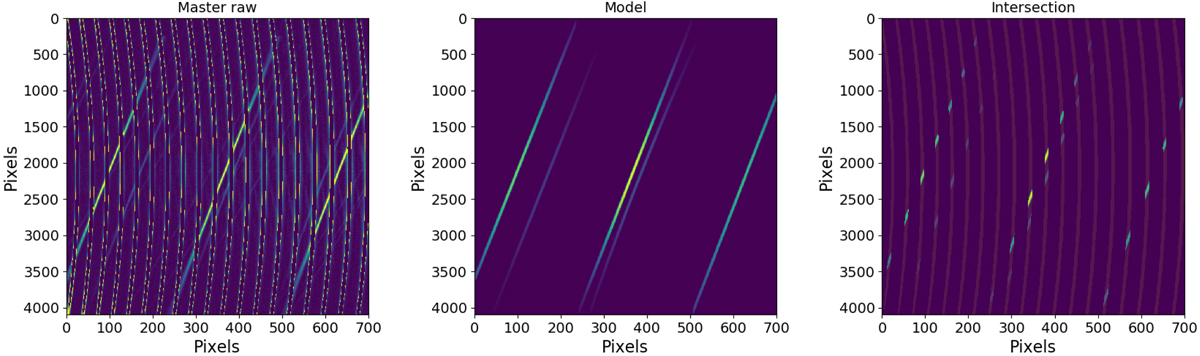
Fig. 5.
Download original image
Derivation of the static product used in the fourth flux correction performed by YARARA dedicated to ghosts contamination. Left: master raw image of the blue detector obtained after stacking two months of FLAT calibration frames when only the science fibre was illuminated. The echelle spectrograph orders are the vertical parabola, which are masked here to highlight the ghosts visible in the background. Middle: ghosts as fitted by our models. Right: map of ghost contamination indicating the location of the ghost of the science fibre on itself. Bright colour highlights the intersection of the ghosts with the physical orders. A similar map was derived for the ghosts of the simultaneous calibration fibre crossing the order of the science fibre.
Current usage metrics show cumulative count of Article Views (full-text article views including HTML views, PDF and ePub downloads, according to the available data) and Abstracts Views on Vision4Press platform.
Data correspond to usage on the plateform after 2015. The current usage metrics is available 48-96 hours after online publication and is updated daily on week days.
Initial download of the metrics may take a while.