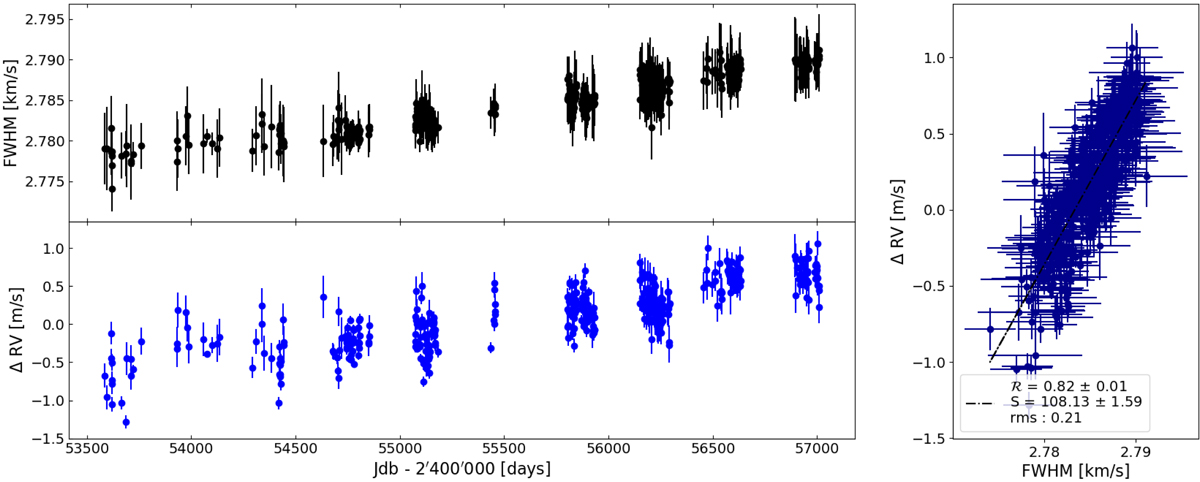
Fig. 4.
Download original image
Visualisation of the focus change due to HARPS ageing on the CCF FWHM and RV time series of HD 10700 obtained with the HARPS G2 mask. Top left: CCF FWHM time series of HD 10700. The star is known to be extremely quiet and the long-term trend observed is likely induced by the instrument ageing. The linear trend is about 1 m s−1 year−1, which proves the impressive stability of HARPS (and HD 10700) over a decade. A similar though decreasing trend is observed in the CCF contrast. Bottom left: RV difference obtained on the RV before and after applying the YARARA correction to the spectral time series. YARARA allows a long-term linear drift of 10 cm s−1 year−1 to be suppressed. Right: correlation plot of the previous time series, which shows the strong dependence between those two quantities, with a Pearson correlation coefficient of 0.82. The 21 cm s−1 rms that we can see in the residuals can be explained by the simultaneous fit of the CCF contrast and CaII S-index along with the FWHM or bad fit on some wavelength columns.
Current usage metrics show cumulative count of Article Views (full-text article views including HTML views, PDF and ePub downloads, according to the available data) and Abstracts Views on Vision4Press platform.
Data correspond to usage on the plateform after 2015. The current usage metrics is available 48-96 hours after online publication and is updated daily on week days.
Initial download of the metrics may take a while.