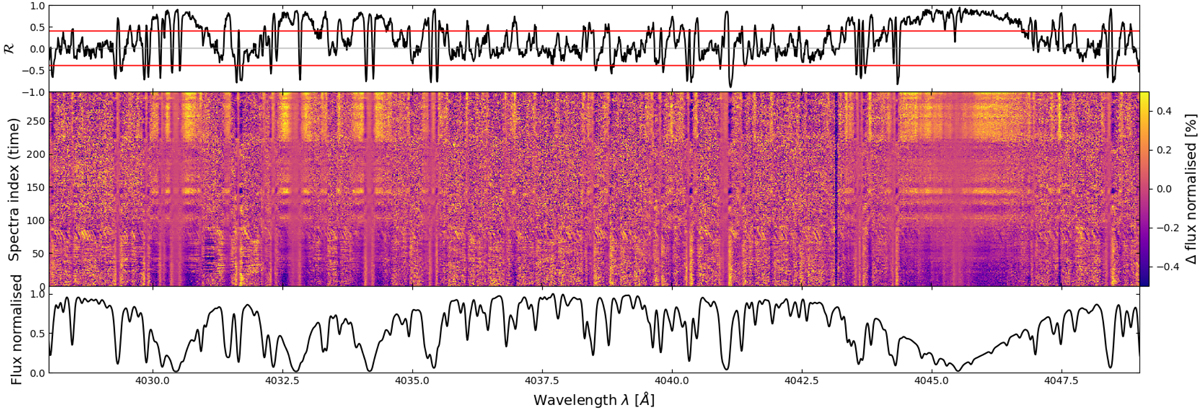
Fig. 3.
Download original image
Illustration of the flux variations induced by stellar activity on α Cen B and its correlation with the S-index on a small wavelength range in the extreme blue. Bottom: master normalised spectrum of α Cen B. Middle: river diagram of the five years of alpha Cen B observations. Some lines clearly show long trend flux variations corresponding to the magnetic cycle of the star. Top: Pearson correlation between the flux variations and the S-index showing, for several wavelengths, a significant correlation with |ℛPearson| > 0.4 (red horizontal lines). Such correlations were already reported by previous studies for the 2010 dataset, such as Thompson et al. (2017), Wise et al. (2018), Ning et al. (2019), and Cretignier et al. (2020a). The 2010 observational season is equivalent to index 102–150 on the figure, for which the rotational modulation is clearly visible.
Current usage metrics show cumulative count of Article Views (full-text article views including HTML views, PDF and ePub downloads, according to the available data) and Abstracts Views on Vision4Press platform.
Data correspond to usage on the plateform after 2015. The current usage metrics is available 48-96 hours after online publication and is updated daily on week days.
Initial download of the metrics may take a while.