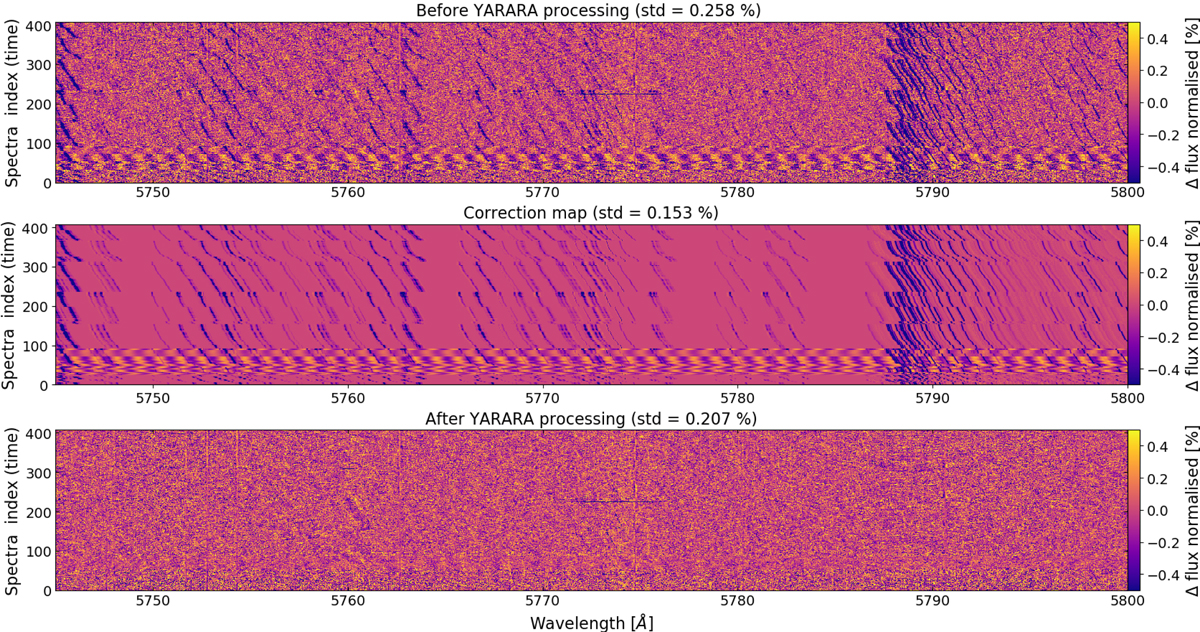
Fig. 2.
Download original image
Second and third flux corrections performed by YARARA to remove interference patterns and telluric absorption lines contaminations on HD 10700. The standard deviation of each residual map is indicated in the title. Top: river diagram before YARARA corrections. Spectra suffer from interference patterns on two observational seasons (from index 30 to 97). Middle: model fitted by YARARA for the contaminations. Bottom: residual river diagram after YARARA correction.
Current usage metrics show cumulative count of Article Views (full-text article views including HTML views, PDF and ePub downloads, according to the available data) and Abstracts Views on Vision4Press platform.
Data correspond to usage on the plateform after 2015. The current usage metrics is available 48-96 hours after online publication and is updated daily on week days.
Initial download of the metrics may take a while.