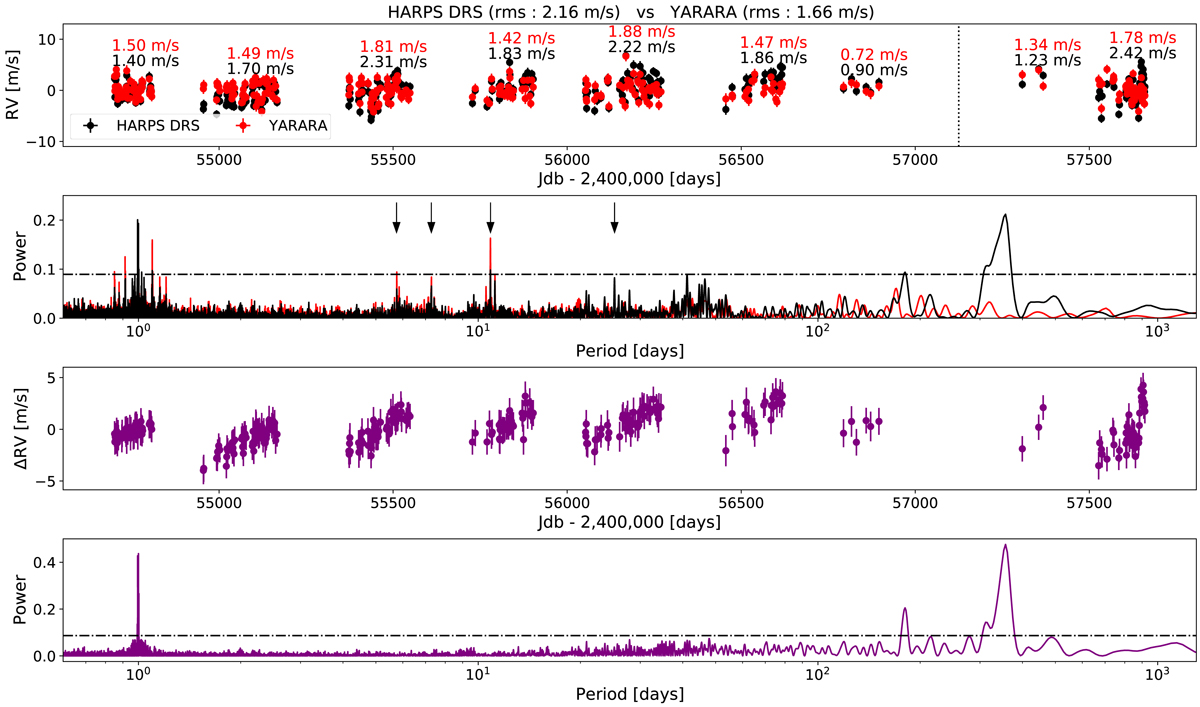
Fig. 14.
Download original image
Application of the YARARA post-processing on the HD 215152 HARPS dataset. First row: comparison of the RV time series extracted with the HARPS DRS (black dots) and after YARARA processing (red dots). Second row: GLS periodogram of the previous time series. The 1% FAP level is indicated as a dotted-dashed line. Exoplanets reported in Delisle(2018) are indicated by black arrows. After YARARA processing, the power at the planetary periods (5.8, 7.3, 10.9 days) are boosted. Third row: RV difference between input and output data. fourth row: GLS periodogram of the RV difference. The removed contaminations were clearly producing most of the signals at one year and its first harmonic.
Current usage metrics show cumulative count of Article Views (full-text article views including HTML views, PDF and ePub downloads, according to the available data) and Abstracts Views on Vision4Press platform.
Data correspond to usage on the plateform after 2015. The current usage metrics is available 48-96 hours after online publication and is updated daily on week days.
Initial download of the metrics may take a while.