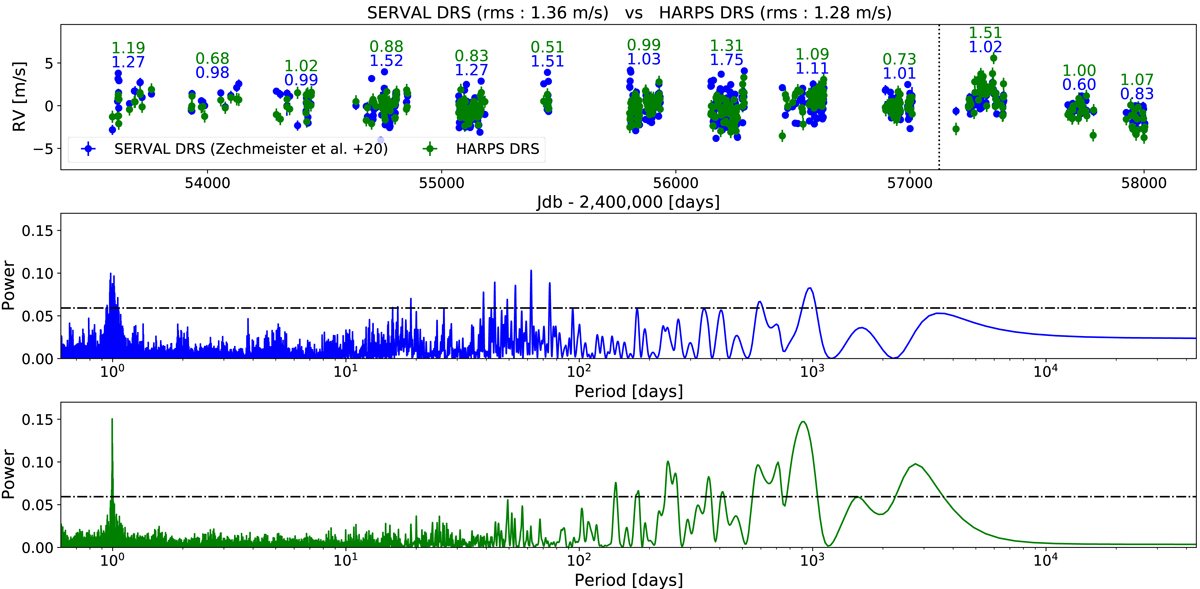
Fig. 10.
Download original image
Comparison between different reduction pipelines for 13 years of HD 10700 HARPS observations. First row: comparison between the SERVAL post-processing pipeline (without night-to-night offset correction; Trifonov et al. 2020; Zechmeister et al. 2020) time series (blue dots) and HARPS DRS (green dots). The weighted rms are indicated for each observational season as well as for the full time series in the title. The HARPS DRS time series present a significantly lower rms in each season before the fibre upgrade (vertical dotted line), whereas the opposite conclusion holds for SERVAL after the upgrade. Second row: GLS periodogram of the SERVAL time series. The 1% FAP level is indicated by the dotted-dashed line. Third row: same as the middle row but for HARPS DRS extracted time series.
Current usage metrics show cumulative count of Article Views (full-text article views including HTML views, PDF and ePub downloads, according to the available data) and Abstracts Views on Vision4Press platform.
Data correspond to usage on the plateform after 2015. The current usage metrics is available 48-96 hours after online publication and is updated daily on week days.
Initial download of the metrics may take a while.