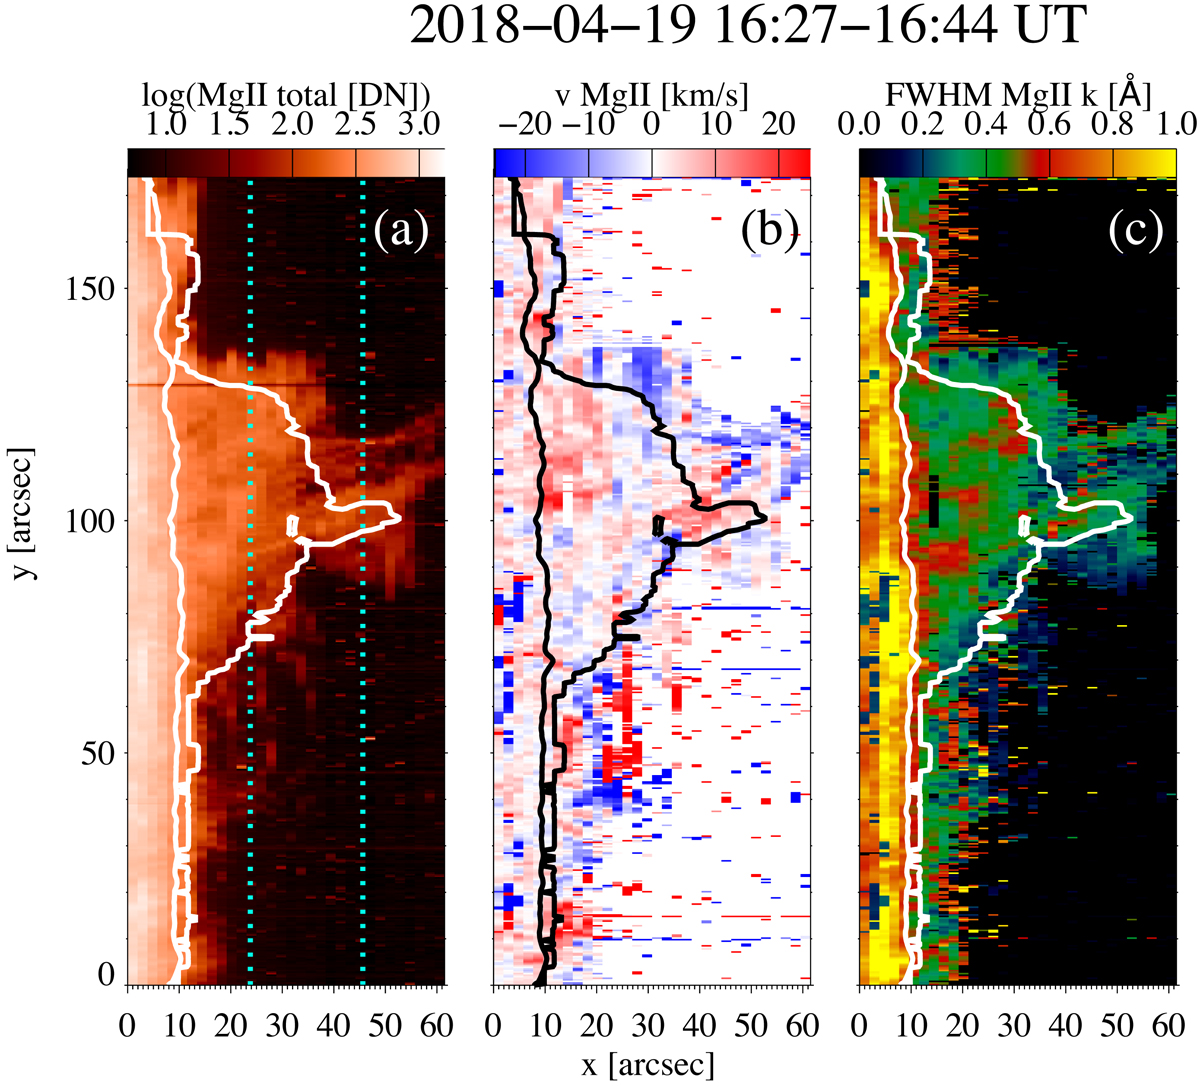
Fig. 8.
Download original image
Prominence reconstructed maps based on the IRIS spectra of Mg II k line (raster 8). (a) Integrated intensity of Mg II k line, (b) Doppler velocity, and (c) width (FWHM) of Mg II k line profile obtained by fitting the profiles with a single Gaussian function. The inner contour line (around x = 10 arcsec) corresponds to the solar surface defined as the level 0.6 Å of the FWHM of Mg II k line; the outer contour corresponds to Mask-Hα based on MSDP observations (see Mask-Hα in Fig. 2). This new contour defined by Mask-Hα (pixels on the disk) is used for the statistics of Mg II parameters in and out the Hα prominence (see Sect. 4.7). The blue dotted lines in panel a are the two selected slit positions (A, B) used to analyse the profiles (Figs. A.3 and A.5) and for plasma parameter diagnostics (Table 3).
Current usage metrics show cumulative count of Article Views (full-text article views including HTML views, PDF and ePub downloads, according to the available data) and Abstracts Views on Vision4Press platform.
Data correspond to usage on the plateform after 2015. The current usage metrics is available 48-96 hours after online publication and is updated daily on week days.
Initial download of the metrics may take a while.