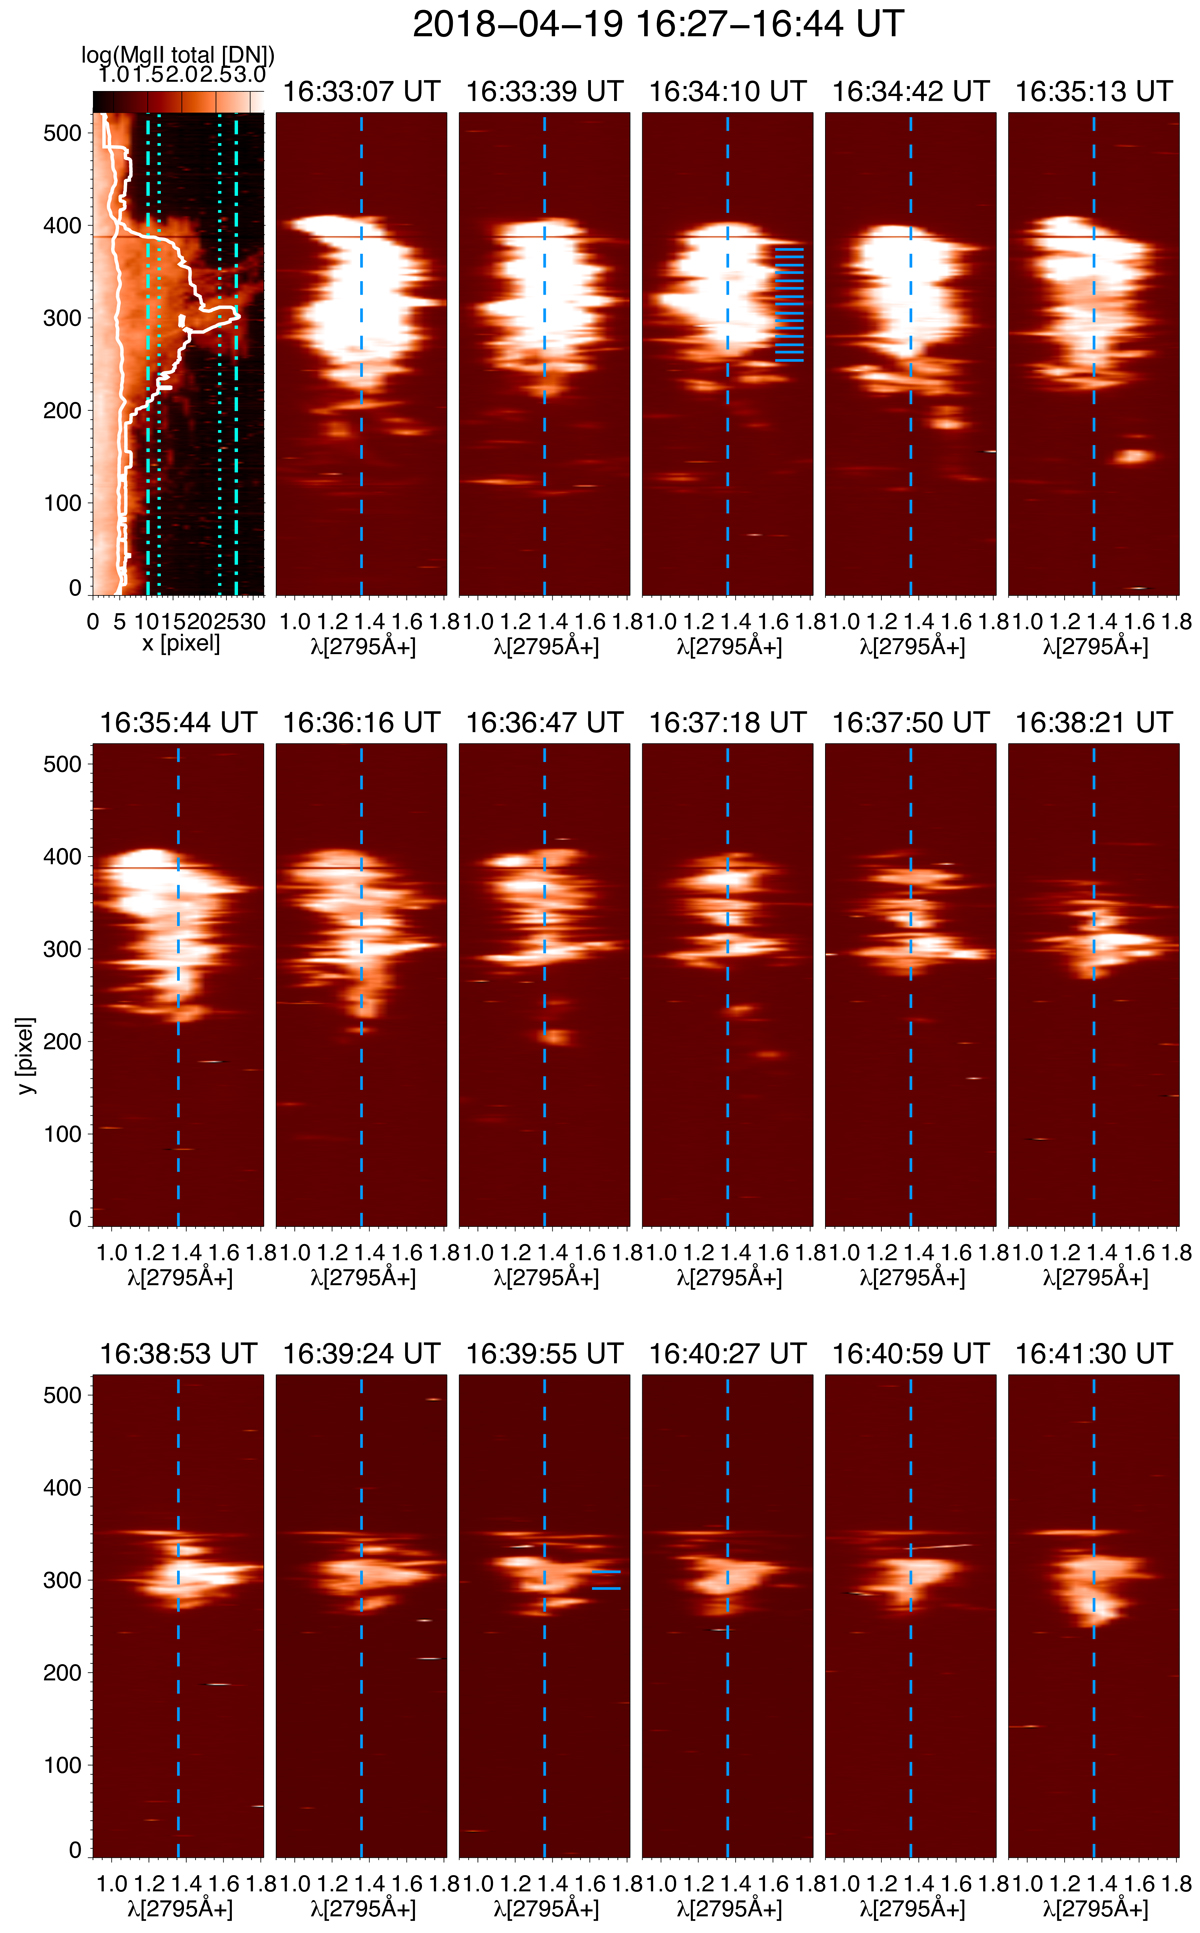
Fig. 7.
Download original image
Prominence spectra of raster 8. First row, left panel: reconstructed map using the integrated intensity of Mg II k line, five following panels: spectra along the slit in positions 10 to 14, second row: in positions 15 to 20, and bottom row: in positions 21 to 26. Upper left panel: the dot-dashed vertical lines represent the extreme slit positions (10 and 26) for which the spectra are shown in this figure. The dotted vertical lines are the two selected slit positions used to analyse the profiles and for plasma parameter diagnostics. In panels of the spectra, the vertical dashed blue line corresponds to the rest velocity. In the panel at 16:34:10 UT (slit position 12), the horizontal lines are the positions corresponding to profiles A1–A15 drawn in Fig. A.2. In the panel at 16:39:55 UT (slit position 23), the horizontal lines limit the domain where the profiles (B1–B11) are shown in Fig. A.4. The y-axis is in pixel units (1 pixel = 0.33 arcsec).
Current usage metrics show cumulative count of Article Views (full-text article views including HTML views, PDF and ePub downloads, according to the available data) and Abstracts Views on Vision4Press platform.
Data correspond to usage on the plateform after 2015. The current usage metrics is available 48-96 hours after online publication and is updated daily on week days.
Initial download of the metrics may take a while.