Fig. 6.
Download original image
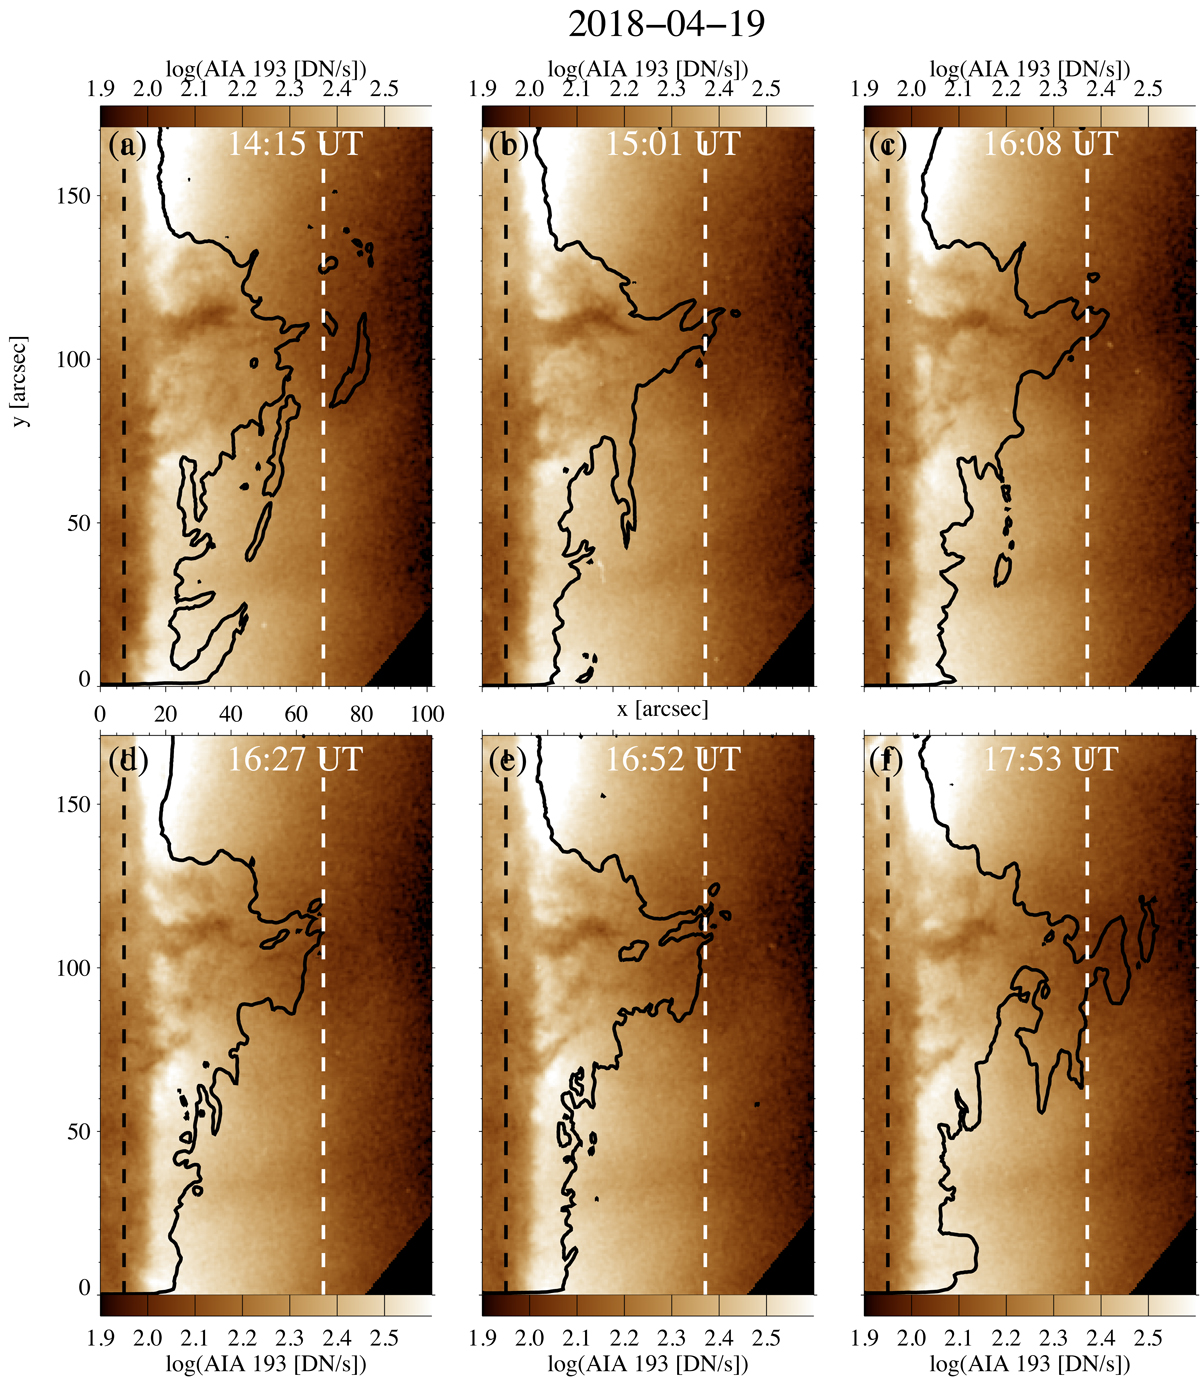
Spatio-temporal evolution of the AIA 193 Å intensity observed between 14:15 UT and 17:53 UT. The vertical dashed lines mark the IRIS raster field of view. The overlaid contour corresponds to the contour of the IRIS SJI 2796, level = 1. The dark features (columns and fuzzy dark material) observed in the prominence correspond to the prominence observed in Hα. The temporal evolution is available as an online movie (Movie4).
Current usage metrics show cumulative count of Article Views (full-text article views including HTML views, PDF and ePub downloads, according to the available data) and Abstracts Views on Vision4Press platform.
Data correspond to usage on the plateform after 2015. The current usage metrics is available 48-96 hours after online publication and is updated daily on week days.
Initial download of the metrics may take a while.