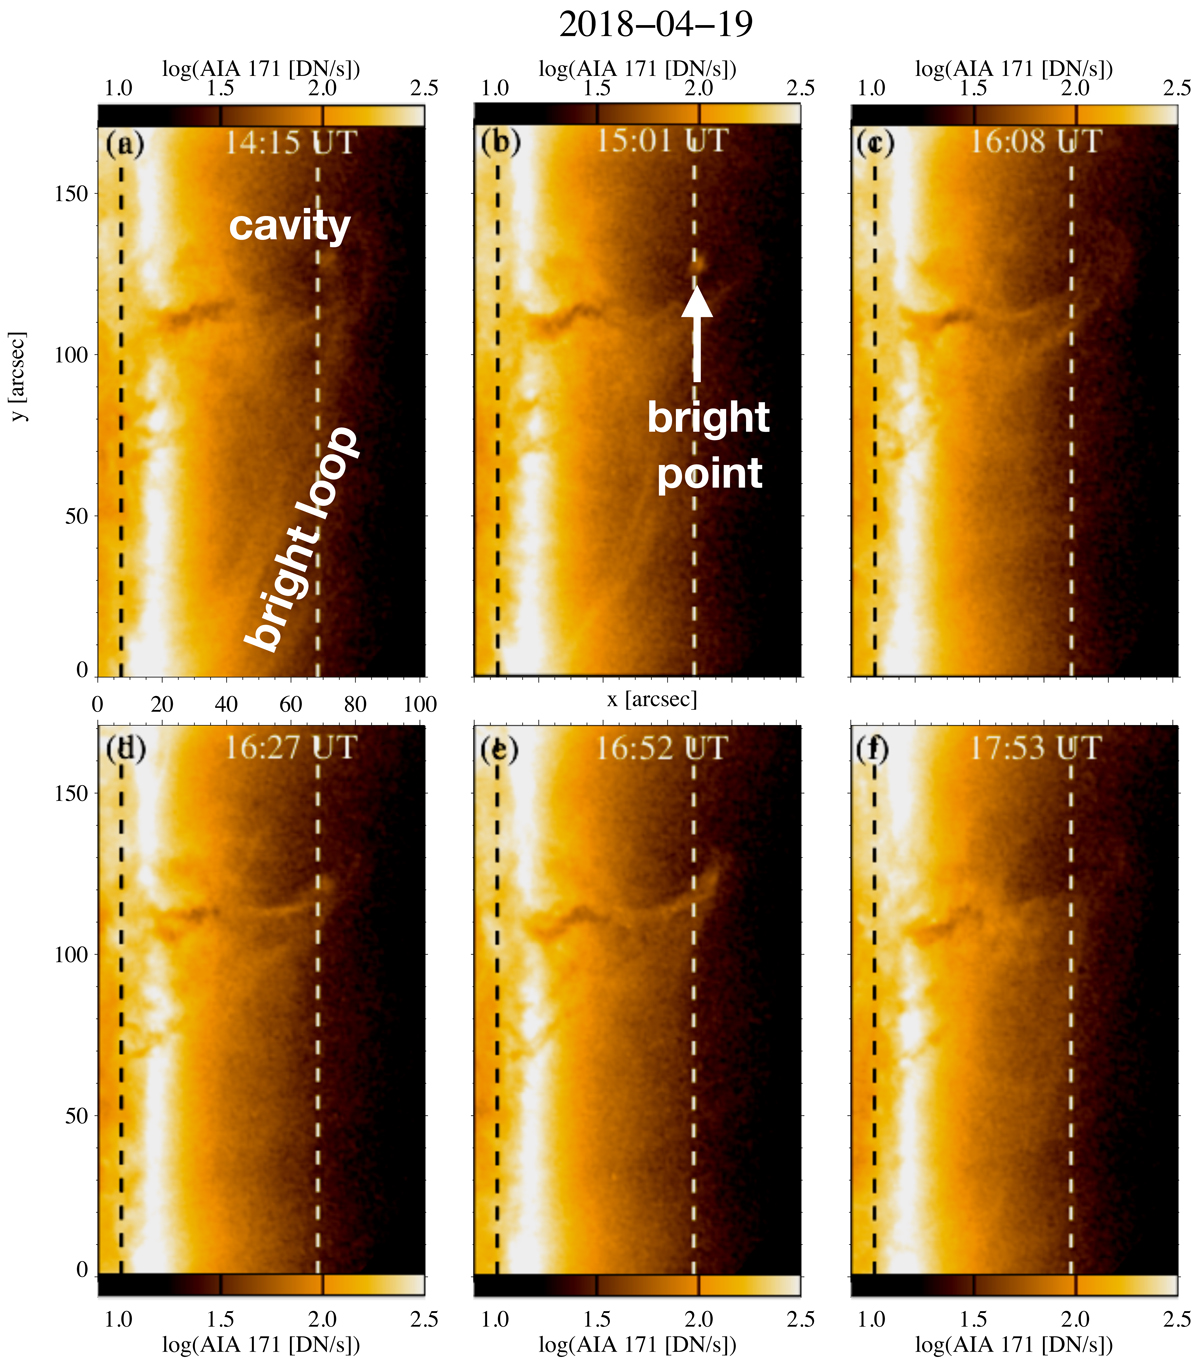
Fig. 5.
Download original image
Spatio-temporal evolution of the AIA 171 Å intensity observed between 14:15 UT and 17:53 UT. The vertical dashed lines mark the IRIS raster field of view. We note the presence of the cavity and long extended bright loop in (a), and a bright point in (b). The cavity is visible in all the panels, and the dark twisted column is surrounded with emission. The temporal evolution is available as an online movie (Movie3).
Current usage metrics show cumulative count of Article Views (full-text article views including HTML views, PDF and ePub downloads, according to the available data) and Abstracts Views on Vision4Press platform.
Data correspond to usage on the plateform after 2015. The current usage metrics is available 48-96 hours after online publication and is updated daily on week days.
Initial download of the metrics may take a while.