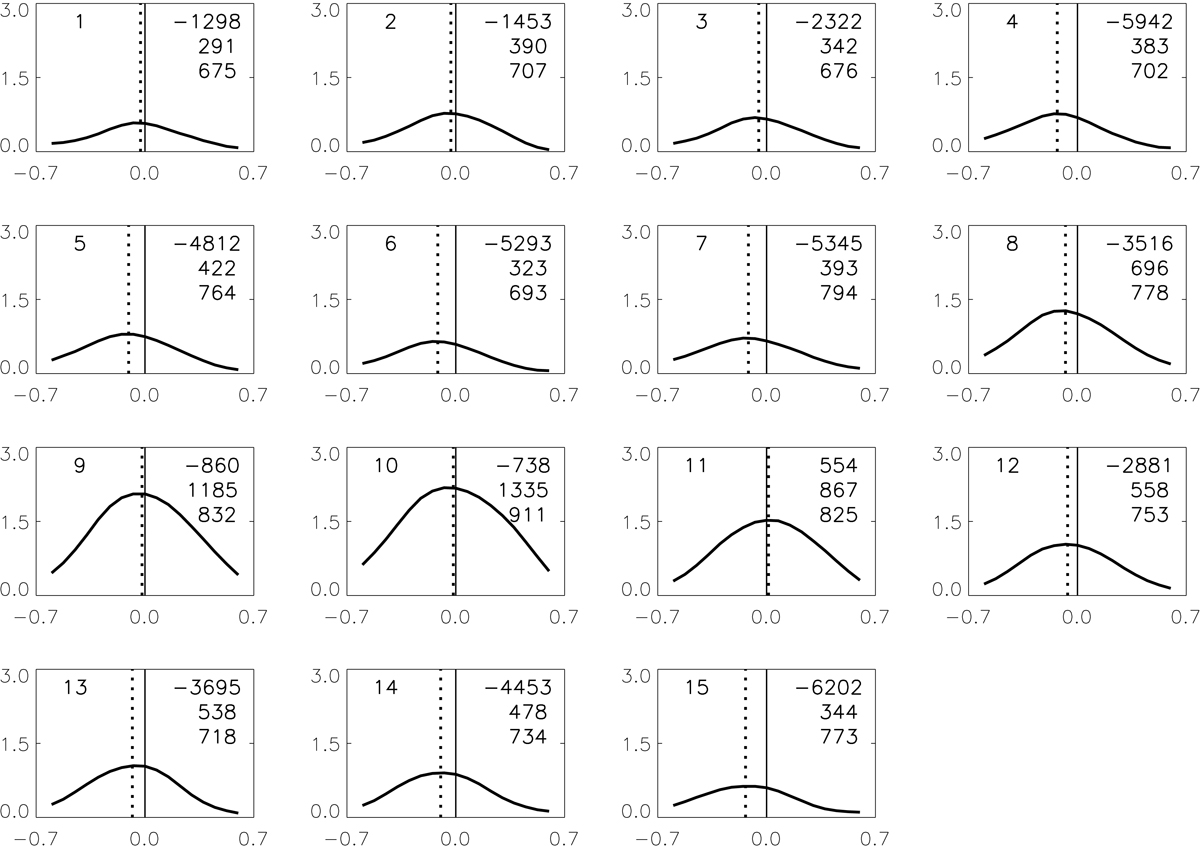
Fig. A.3.
Download original image
Example MSDP prominence profiles in the main part at 16:25 UT. Intensities are in 10−6 erg s−1 cm−2 sr−1 Hz−1, and wavelength on the x-axis is in Å. In the right corner, the velocities in m/s at Hα ±0.3 Å are indicated; below, the integrated intensity in erg sr−1 s−1 cm−2 divided by 100 is shown; and on the last row the FWHM in mÅ. In the left corner, the number of the pixel corresponds to points A1-A15 to pixels along the vertical A line in Fig. 2 (a) and in Table 3.
Current usage metrics show cumulative count of Article Views (full-text article views including HTML views, PDF and ePub downloads, according to the available data) and Abstracts Views on Vision4Press platform.
Data correspond to usage on the plateform after 2015. The current usage metrics is available 48-96 hours after online publication and is updated daily on week days.
Initial download of the metrics may take a while.